Compute the Curvewise interval (CWI) (also called the "simultaneous interval" or "joint interval") of posterior distributions using ggdist::curve_interval().
Whereas the more typical "pointwise intervals" contain xx% of the posterior for a single parameter,
joint/curvewise intervals contain xx% of the posterior distribution for all parameters.
Arguments
- x
Vector representing a posterior distribution, or a data frame of such vectors. Can also be a Bayesian model. bayestestR supports a wide range of models (see, for example,
methods("hdi")) and not all of those are documented in the 'Usage' section, because methods for other classes mostly resemble the arguments of the.numericor.data.framemethods.- ...
Currently not used.
- ci
Value or vector of probability of the (credible) interval - CI (between 0 and 1) to be estimated. Default to
.95(95%).
Value
A data frame with following columns:
ParameterThe model parameter(s), ifxis a model-object. Ifxis a vector, this column is missing.CIThe probability of the credible interval.CI_low,CI_highThe lower and upper credible interval limits for the parameters.
Details
Applied model predictions, pointwise intervals contain xx% of the predicted response values conditional on specific predictor values. In contrast, curvewise intervals contain xx% of the predicted response values across all predictor values. Put another way, curvewise intervals contain xx% of the full prediction lines from the model.
For more details, see the ggdist documentation on curvewise intervals.
Examples
# \donttest{
library(bayestestR)
if (require("ggplot2") && require("rstanarm") && require("ggdist")) {
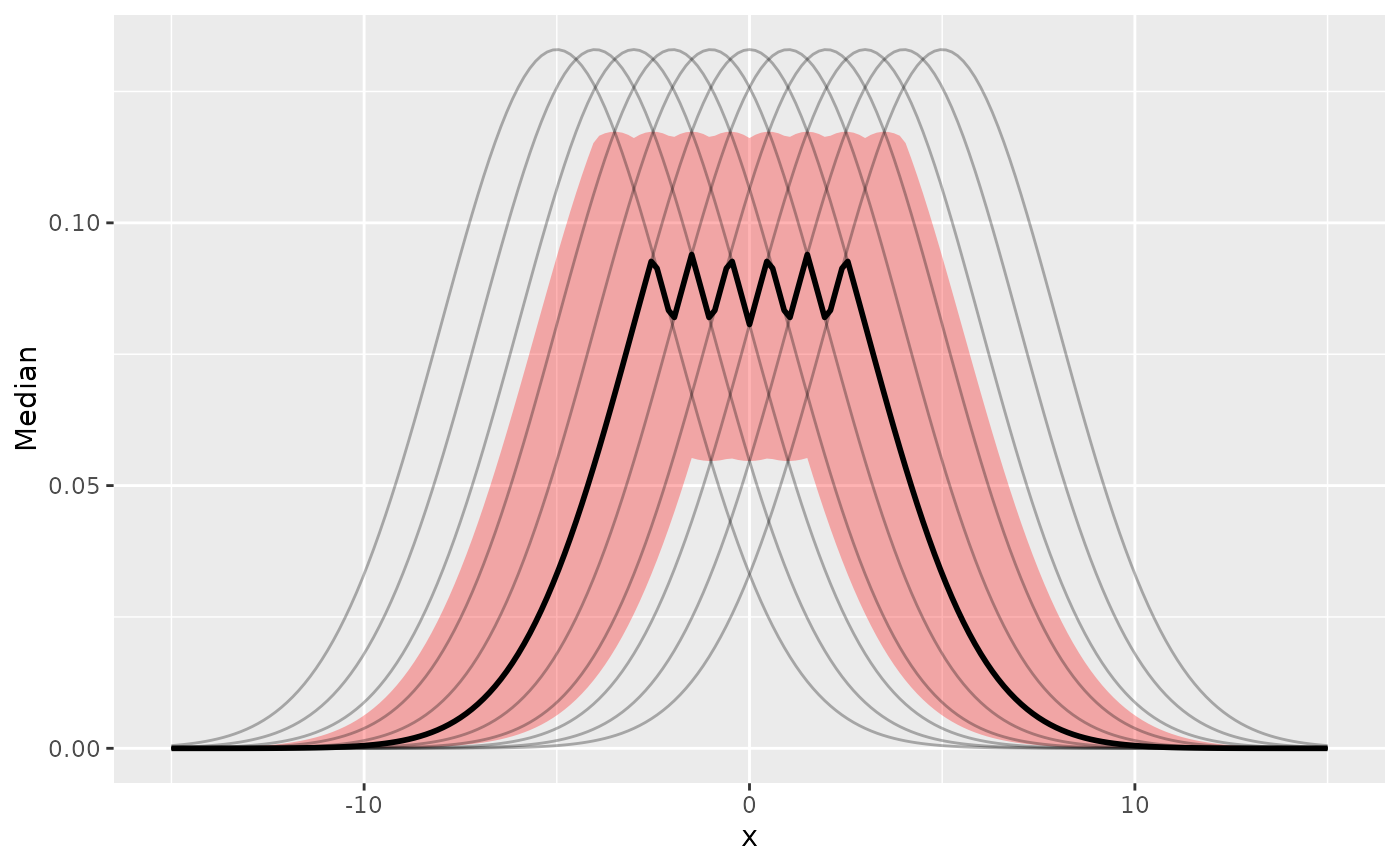
# Generate data =============================================
k <- 11 # number of curves (iterations)
n <- 201 # number of rows
data <- data.frame(x = seq(-15, 15, length.out = n))
# Simulate iterations as new columns
for (i in 1:k) {
data[paste0("iter_", i)] <- dnorm(data$x, seq(-5, 5, length.out = k)[i], 3)
}
# Note: first, we need to transpose the data to have iters as rows
iters <- datawizard::data_transpose(data[paste0("iter_", 1:k)])
# Compute Median
data$Median <- point_estimate(iters)[["Median"]]
# Compute Credible Intervals ================================
# Compute ETI (default type of CI)
data[c("ETI_low", "ETI_high")] <- eti(iters, ci = 0.5)[c("CI_low", "CI_high")]
# Compute CWI
# ggdist::curve_interval(reshape_iterations(data), iter_value .width = 0.5)
# Visualization =============================================
ggplot(data, aes(x = x, y = Median)) +
geom_ribbon(aes(ymin = ETI_low, ymax = ETI_high), fill = "red", alpha = 0.3) +
geom_line(linewidth = 1) +
geom_line(
data = reshape_iterations(data),
aes(y = iter_value, group = iter_group),
alpha = 0.3
)
}
#> Loading required package: ggplot2
#> Loading required package: ggdist
#>
#> Attaching package: ‘ggdist’
#> The following objects are masked from ‘package:brms’:
#>
#> dstudent_t, pstudent_t, qstudent_t, rstudent_t
#> The following object is masked from ‘package:bayestestR’:
#>
#> hdi
 # }
# }