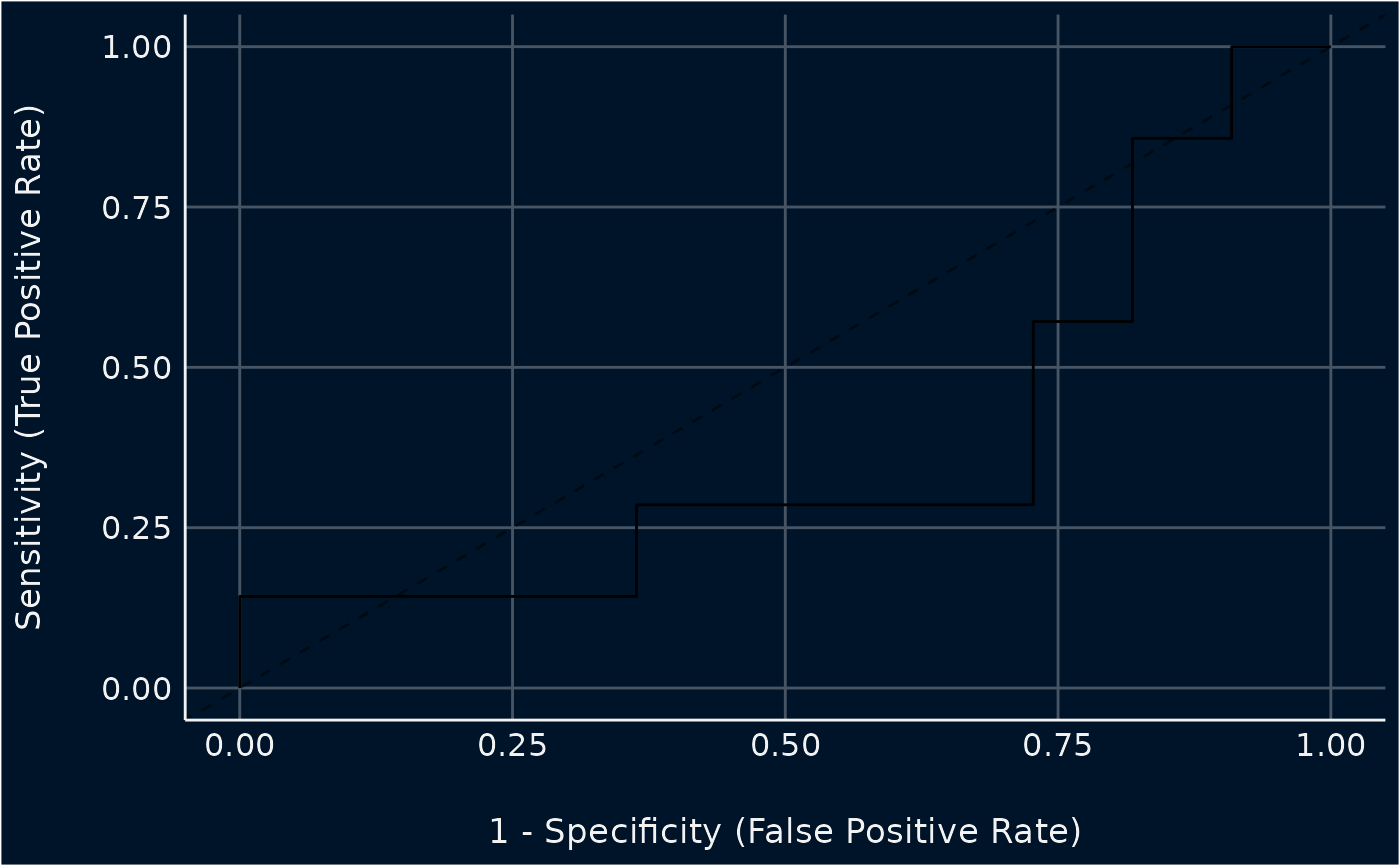
The plot() method for the performance::performance_roc()
function.
Usage
# S3 method for class 'see_performance_roc'
plot(x, ...)Examples
library(performance)
data(iris)
set.seed(123)
iris$y <- rbinom(nrow(iris), size = 1, .3)

folds <- sample(nrow(iris), size = nrow(iris) / 8, replace = FALSE)
test_data <- iris[folds, ]
train_data <- iris[-folds, ]

model <- glm(y ~ Sepal.Length + Sepal.Width, data = train_data, family = "binomial")
result <- performance_roc(model, new_data = test_data)
result
#> AUC: 37.66%
plot(result)