Plot method for (non-)constant error variance checks
Source:R/plot.check_heteroscedasticity.R
plot.see_check_heteroscedasticity.RdThe plot() method for the
performance::check_heteroscedasticity() function.
Usage
# S3 method for class 'see_check_heteroscedasticity'
plot(
  x,
  data = NULL,
  size_point = 2,
  size_line = 0.8,
  size_title = 12,
  size_axis_title = base_size,
  base_size = 10,
  theme = NULL,
  ...
)
Arguments
- x
An object.
- data
The original data used to create this object. Can be a statistical model.
- size_point
Numeric specifying size of point-geoms.
- size_line
Numeric value specifying size of line geoms.
- base_size, size_axis_title, size_title
Numeric value specifying size of axis and plot titles.
- theme
A ggplot2-theme function, e.g.
theme = theme_lucid()ortheme = ggplot2::theme_dark().- ...
Arguments passed to or from other methods.
See also
See also the vignette about check_model().
Examples
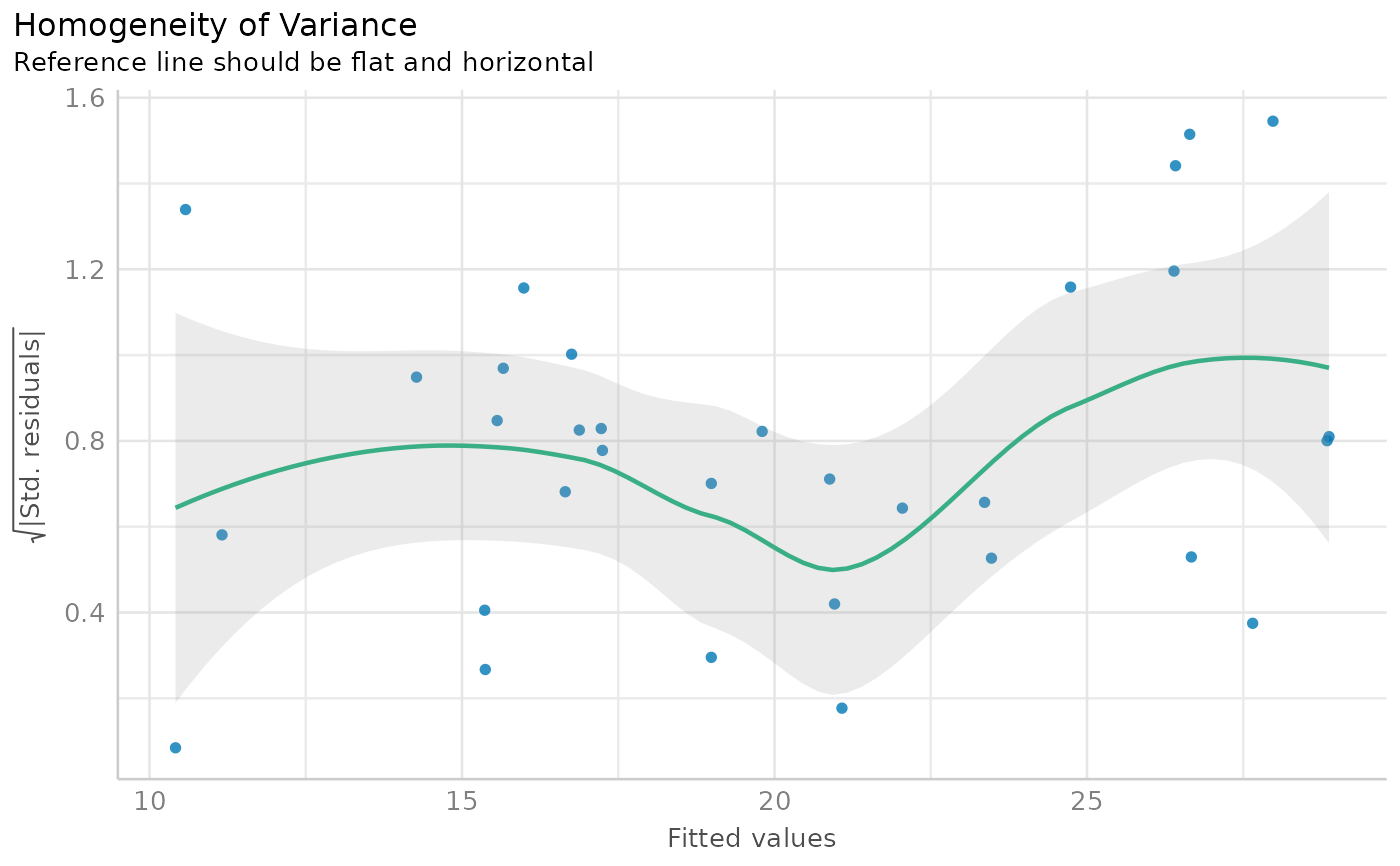
m <- lm(mpg ~ wt + cyl + gear + disp, data = mtcars)
result <- performance::check_heteroscedasticity(m)
result
#> Warning: Heteroscedasticity (non-constant error variance) detected (p = 0.042).
#>
plot(result, data = m) # data required for pkgdown