Plot method for classifying the distribution of a model-family
Source:R/plot.check_distribution.R
plot.see_check_distribution.RdThe plot() method for the performance::check_distribution()
function.
Usage
# S3 method for class 'see_check_distribution'
plot(x, size_point = 2, panel = TRUE, ...)Examples
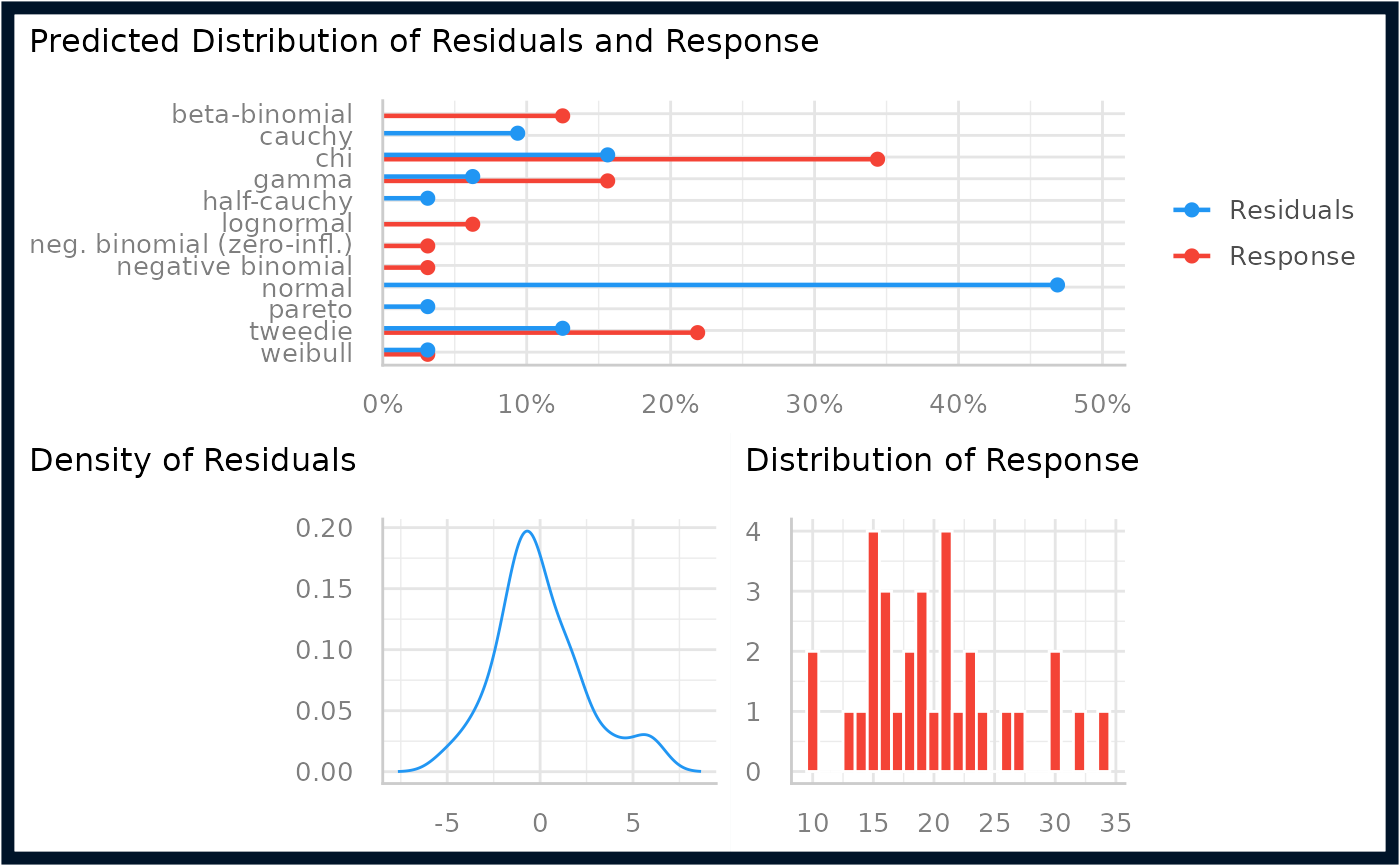
library(performance)
m <<- lm(mpg ~ wt + cyl + gear + disp, data = mtcars)
result <- check_distribution(m)
result
#> # Distribution of Model Family
#>
#> Predicted Distribution of Residuals
#>
#>  Distribution Probability
#>        normal         47%
#>           chi         16%
#>       tweedie         12%
#>
#> Predicted Distribution of Response
#>
#>  Distribution Probability
#>           chi         34%
#>       tweedie         22%
#>         gamma         16%
plot(result)