Plot method for Bayes Factors for model comparison
Source:R/plot.bayesfactor_models.R
plot.see_bayesfactor_models.RdThe plot() method for the bayestestR::bayesfactor_models() function.
These plots visualize the posterior probabilities of the compared models.
Usage
# S3 method for class 'see_bayesfactor_models'
plot(
  x,
  n_pies = "one",
  value = "none",
  sort = FALSE,
  log = FALSE,
  prior_odds = NULL,
  ...
)
Arguments
- x
An object.
- n_pies
Number of pies. Can be
"one"or"many".- value
What value to display. Can be
"none","BF", or"probability".- sort
The behavior of this argument depends on the plotting contexts.
Plotting model parameters: If
NULL, coefficients are plotted in the order as they appear in the summary. Settingsort = "ascending"orsort = "descending"sorts coefficients in ascending or descending order, respectively. Settingsort = TRUEis the same assort = "ascending".Plotting Bayes factors: Sort pie-slices by posterior probability (descending)?
- log
Logical that decides whether to display log-transformed Bayes factors.
- prior_odds
An optional vector of prior odds for the models. See
BayesFactor::priorOdds. As the size of the pizza slices corresponds to posterior probability (which is a function of prior probability and the Bayes Factor), customprior_oddswill change the slices' size.- ...
Arguments passed to or from other methods.
Examples
library(bayestestR)
library(see)
lm0 <- lm(qsec ~ 1, data = mtcars)
lm1 <- lm(qsec ~ drat, data = mtcars)
lm2 <- lm(qsec ~ wt, data = mtcars)
lm3 <- lm(qsec ~ drat + wt, data = mtcars)
result <- bayesfactor_models(lm1, lm2, lm3, denominator = lm0)
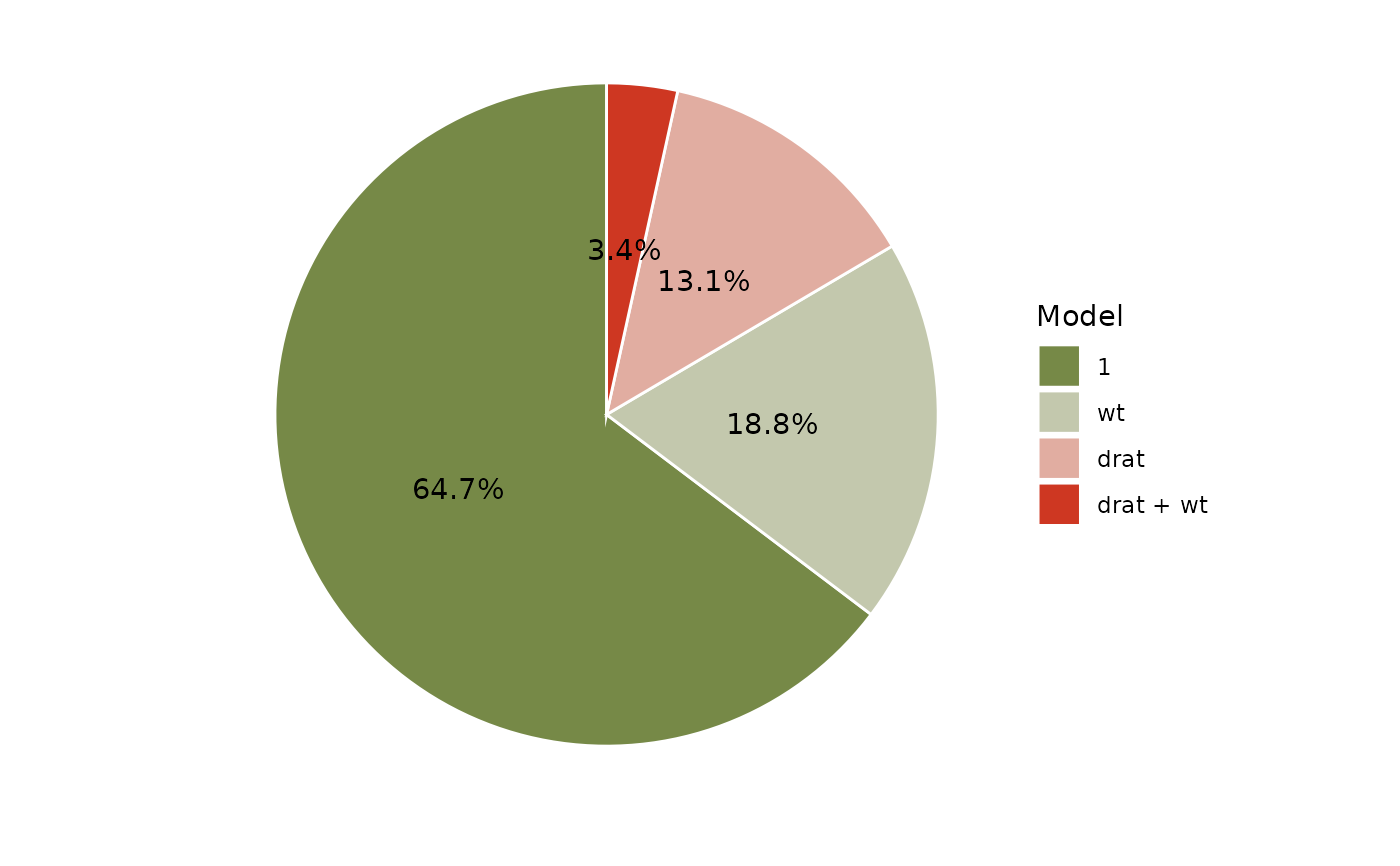
plot(result, n_pies = "one", value = "probability", sort = TRUE) +
scale_fill_pizza(reverse = TRUE)
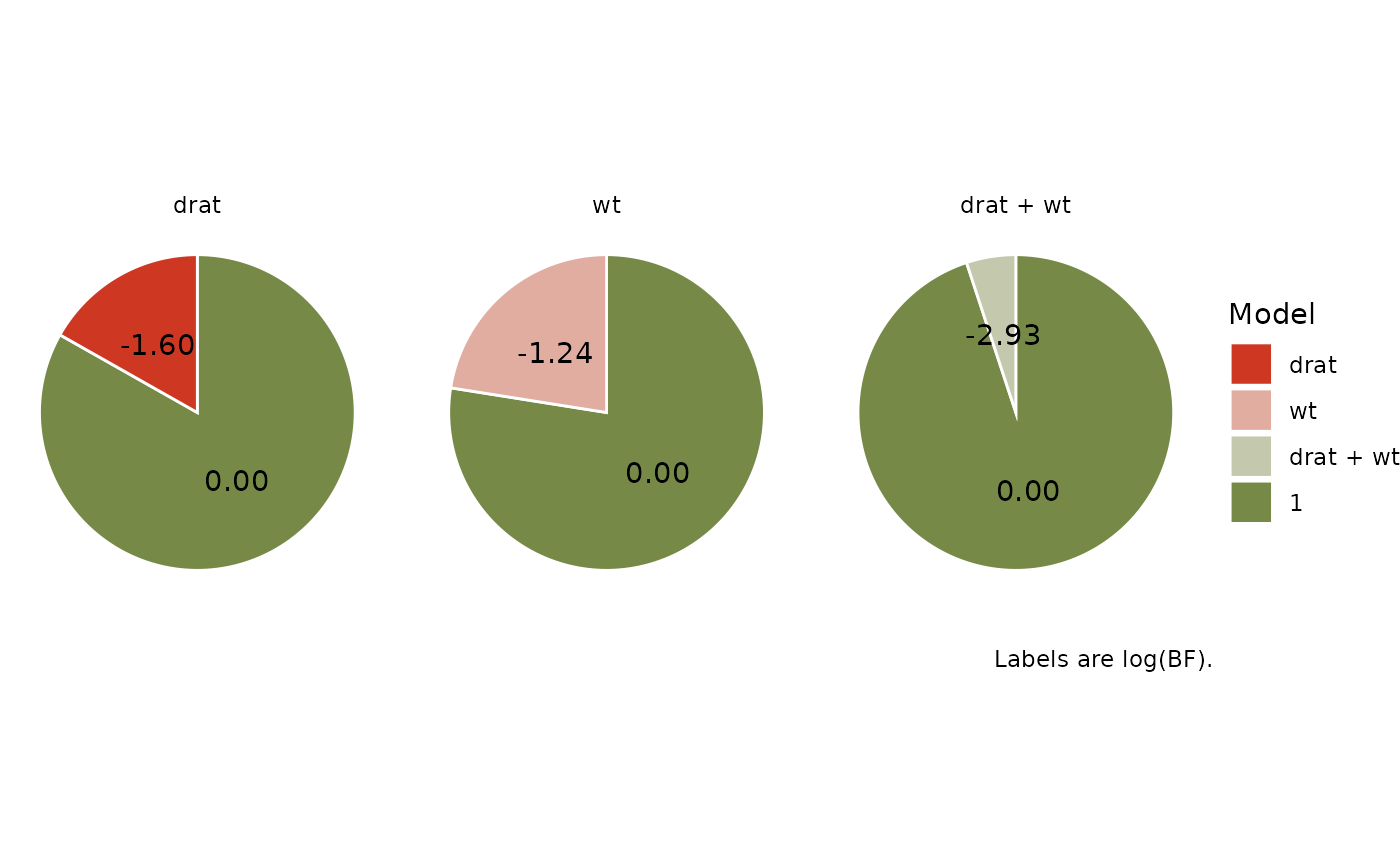
 plot(result, n_pies = "many", value = "BF", log = TRUE) +
scale_fill_pizza(reverse = FALSE)
plot(result, n_pies = "many", value = "BF", log = TRUE) +
scale_fill_pizza(reverse = FALSE)