The palette based on Metro Metro colors.
Use scale_color_metro_d for discrete categories and scale_color_metro_c
for a continuous scale, or use the discrete argument in
scale_color_metro().
Usage
scale_color_metro(
  palette = NULL,
  discrete = TRUE,
  reverse = FALSE,
  aesthetics = "color",
  ...
)

scale_color_metro_d(
  palette = NULL,
  discrete = TRUE,
  reverse = FALSE,
  aesthetics = "color",
  ...
)

scale_color_metro_c(
  palette = NULL,
  discrete = FALSE,
  reverse = FALSE,
  aesthetics = "color",
  ...
)

scale_colour_metro(
  palette = NULL,
  discrete = TRUE,
  reverse = FALSE,
  aesthetics = "color",
  ...
)

scale_colour_metro_c(
  palette = NULL,
  discrete = FALSE,
  reverse = FALSE,
  aesthetics = "color",
  ...
)

scale_colour_metro_d(
  palette = NULL,
  discrete = TRUE,
  reverse = FALSE,
  aesthetics = "color",
  ...
)

scale_fill_metro(
  palette = NULL,
  discrete = TRUE,
  reverse = FALSE,
  aesthetics = "fill",
  ...
)

scale_fill_metro_d(
  palette = NULL,
  discrete = TRUE,
  reverse = FALSE,
  aesthetics = "fill",
  ...
)

scale_fill_metro_c(
  palette = NULL,
  discrete = FALSE,
  reverse = FALSE,
  aesthetics = "fill",
  ...
)
Arguments
- palette
Character name of palette. Depending on the color scale, can be one of
"full","ice","rainbow","complement","contrast","light"(for dark themes),"black_first",full_original, orblack_first_original. The latter three options are especially for the Okabe-Ito color palette. The default isNULLand either"contrast"or"gradient"is used (depending on whetherdiscreteisTRUEorFALSE), which are the two scale useful for discrete or gradient color scales, respectively.- discrete
Boolean indicating whether color aesthetic is discrete or not.
- reverse
Boolean indicating whether the palette should be reversed.
- aesthetics
A vector of names of the aesthetics that this scale should be applied to (e.g.,
c('color', 'fill')).- ...
Additional arguments to pass to
colorRampPalette().
Examples
library(ggplot2)
library(see)
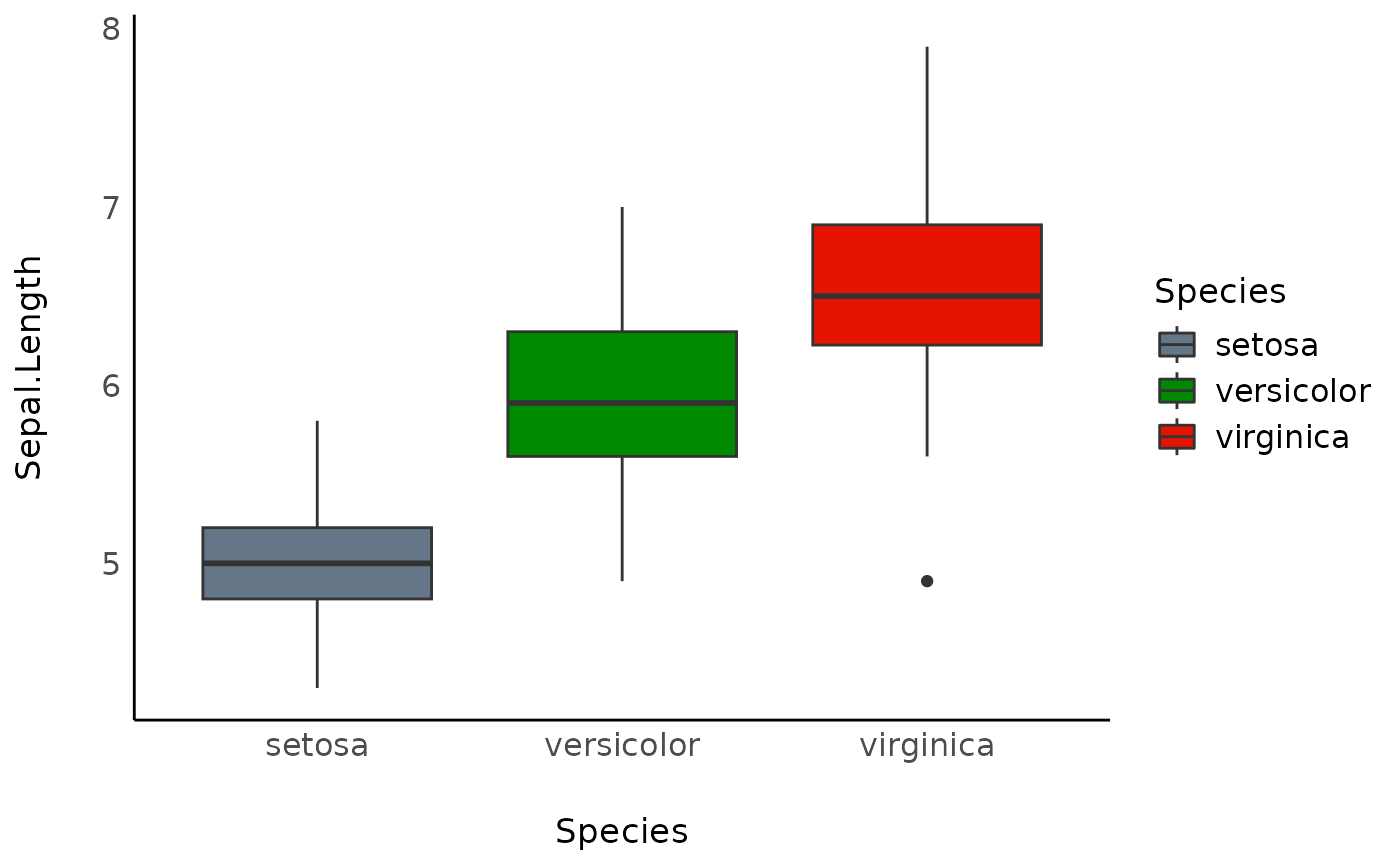
ggplot(iris, aes(x = Species, y = Sepal.Length, fill = Species)) +
geom_boxplot() +
theme_modern() +
scale_fill_metro()
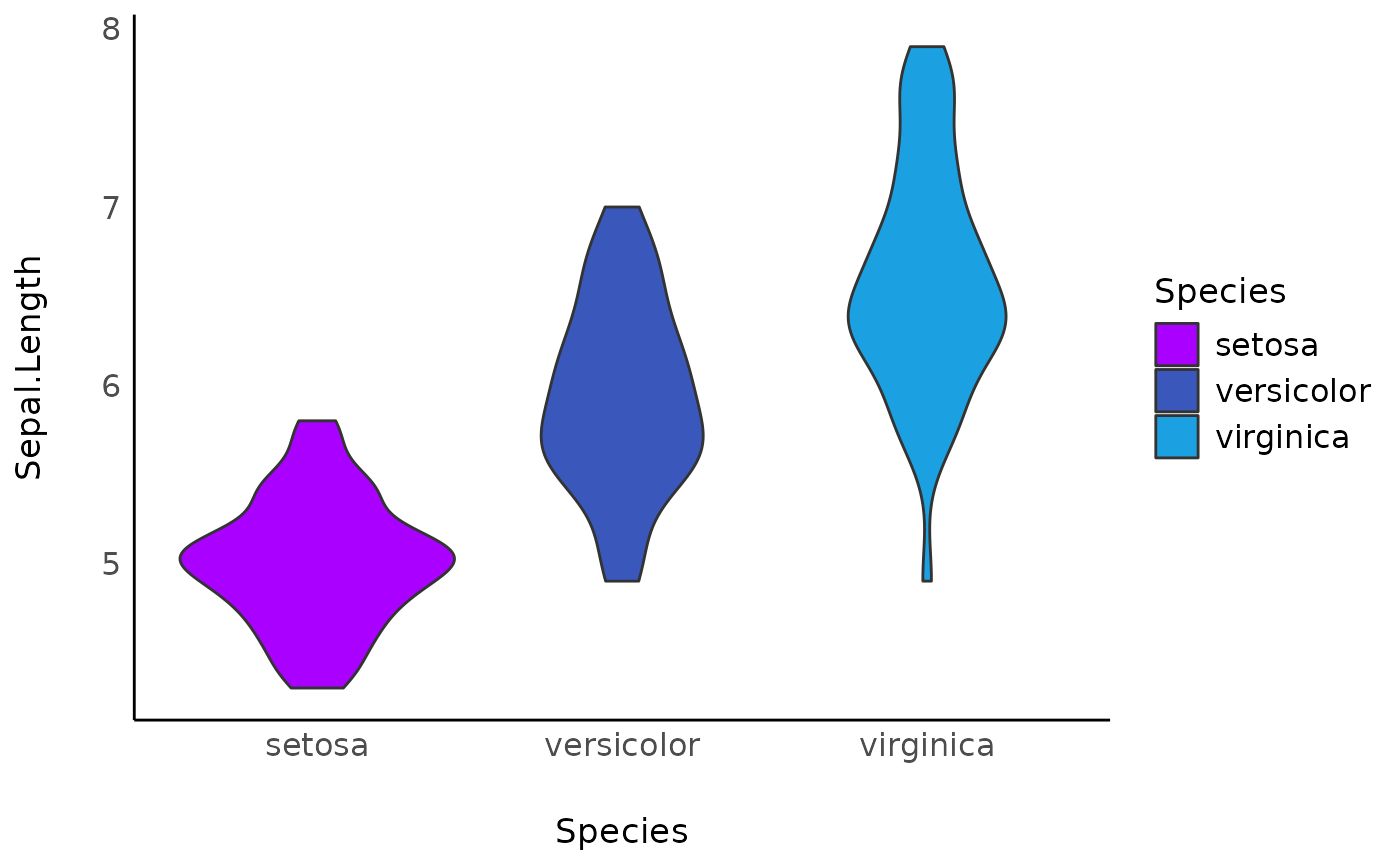
 ggplot(iris, aes(x = Species, y = Sepal.Length, fill = Species)) +
geom_violin() +
theme_modern() +
scale_fill_metro(palette = "ice")
ggplot(iris, aes(x = Species, y = Sepal.Length, fill = Species)) +
geom_violin() +
theme_modern() +
scale_fill_metro(palette = "ice")
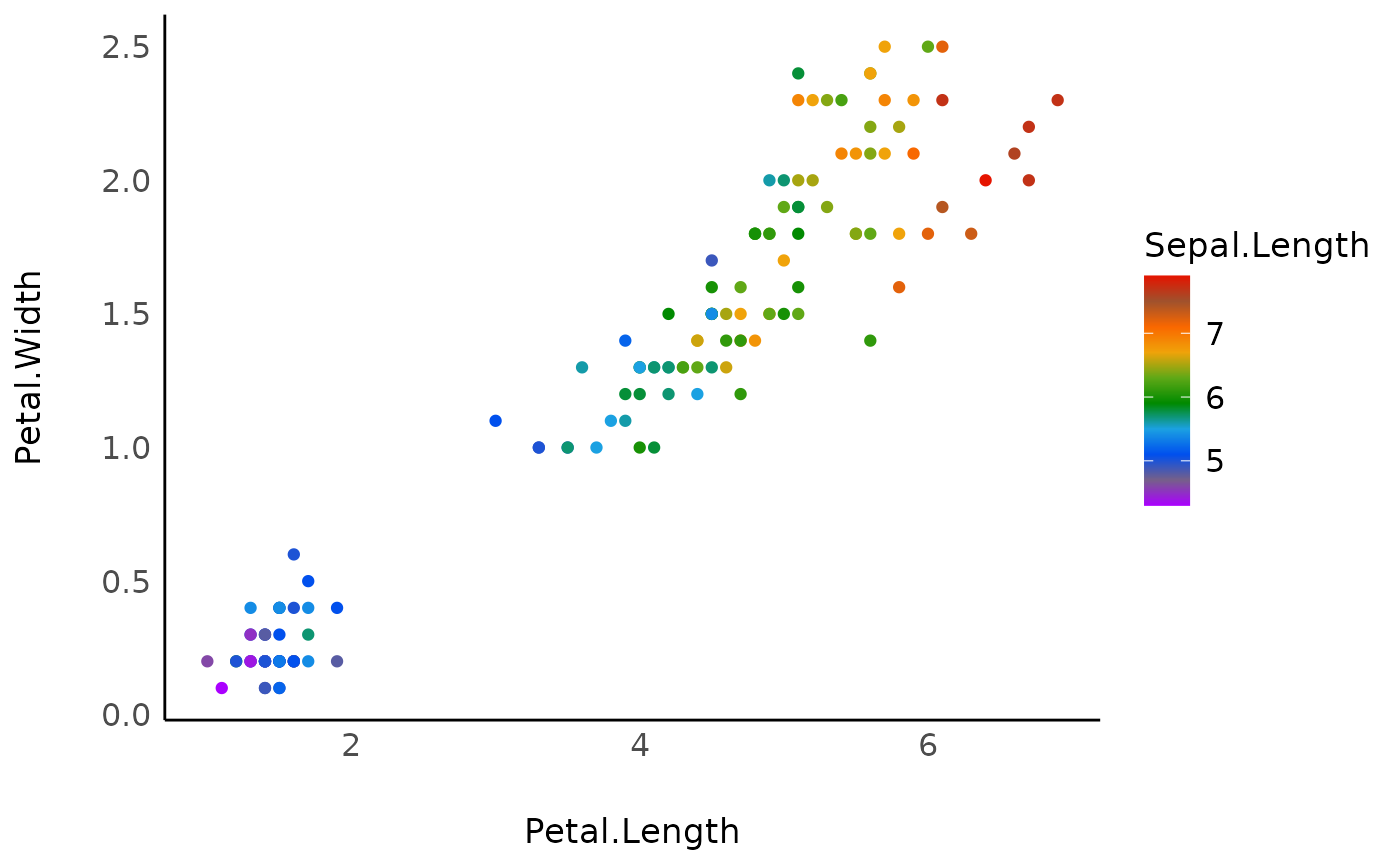
 ggplot(iris, aes(x = Petal.Length, y = Petal.Width, color = Sepal.Length)) +
geom_point() +
theme_modern() +
scale_color_metro(discrete = FALSE)
ggplot(iris, aes(x = Petal.Length, y = Petal.Width, color = Sepal.Length)) +
geom_point() +
theme_modern() +
scale_color_metro(discrete = FALSE)