Plot method for posterior predictive checks
Source:R/plot.check_predictions.R
print.see_performance_pp_check.RdThe plot() method for the performance::check_predictions() function.
Usage
# S3 method for class 'see_performance_pp_check'
print(
  x,
  size_line = 0.5,
  size_point = 2,
  size_bar = 0.7,
  size_axis_title = base_size,
  size_title = 12,
  base_size = 10,
  alpha_line = 0.15,
  theme = NULL,
  colors = unname(social_colors(c("green", "blue"))),
  type = "density",
  x_limits = NULL,
  ...
)

# S3 method for class 'see_performance_pp_check'
plot(
  x,
  size_line = 0.5,
  size_point = 2,
  size_bar = 0.7,
  size_axis_title = base_size,
  size_title = 12,
  base_size = 10,
  alpha_line = 0.15,
  theme = NULL,
  colors = unname(social_colors(c("green", "blue"))),
  type = "density",
  x_limits = NULL,
  ...
)
Arguments
- x
An object.
- size_line
Numeric value specifying size of line geoms.
- size_point
Numeric specifying size of point-geoms.
- size_bar
Size of bar geoms.
- base_size, size_axis_title, size_title
Numeric value specifying size of axis and plot titles.
- alpha_line
Numeric value specifying alpha of lines indicating
yrep.- theme
A ggplot2-theme function, e.g.
theme = theme_lucid()ortheme = ggplot2::theme_dark().- colors
Character vector of length two, indicating the colors (in hex-format) for points and line.
- type
Plot type for the posterior predictive checks plot. Can be
"density"(default),"discrete_dots","discrete_interval"or"discrete_both"(thediscrete_*options are appropriate for models with discrete - binary, integer or ordinal etc. - outcomes).- x_limits
Numeric vector of length 2 specifying the limits of the x-axis. If not
NULL, will zoom in the x-axis to the specified limits.- ...
Arguments passed to or from other methods.
See also
See also the vignette about check_model().
Examples
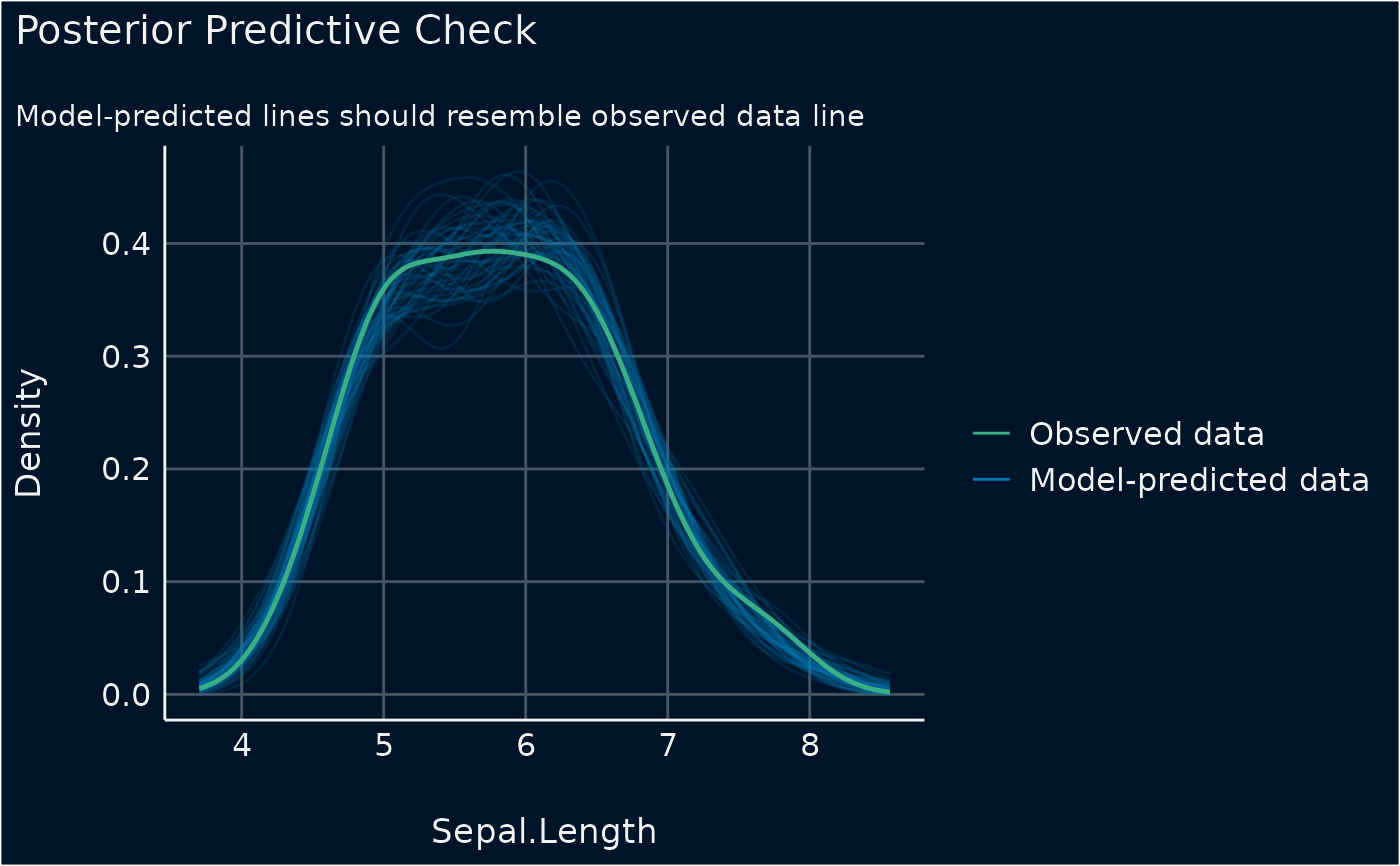
library(performance)
model <- lm(Sepal.Length ~ Species * Petal.Width + Petal.Length, data = iris)
check_predictions(model)
#> Ignoring unknown labels:
#> • size : ""
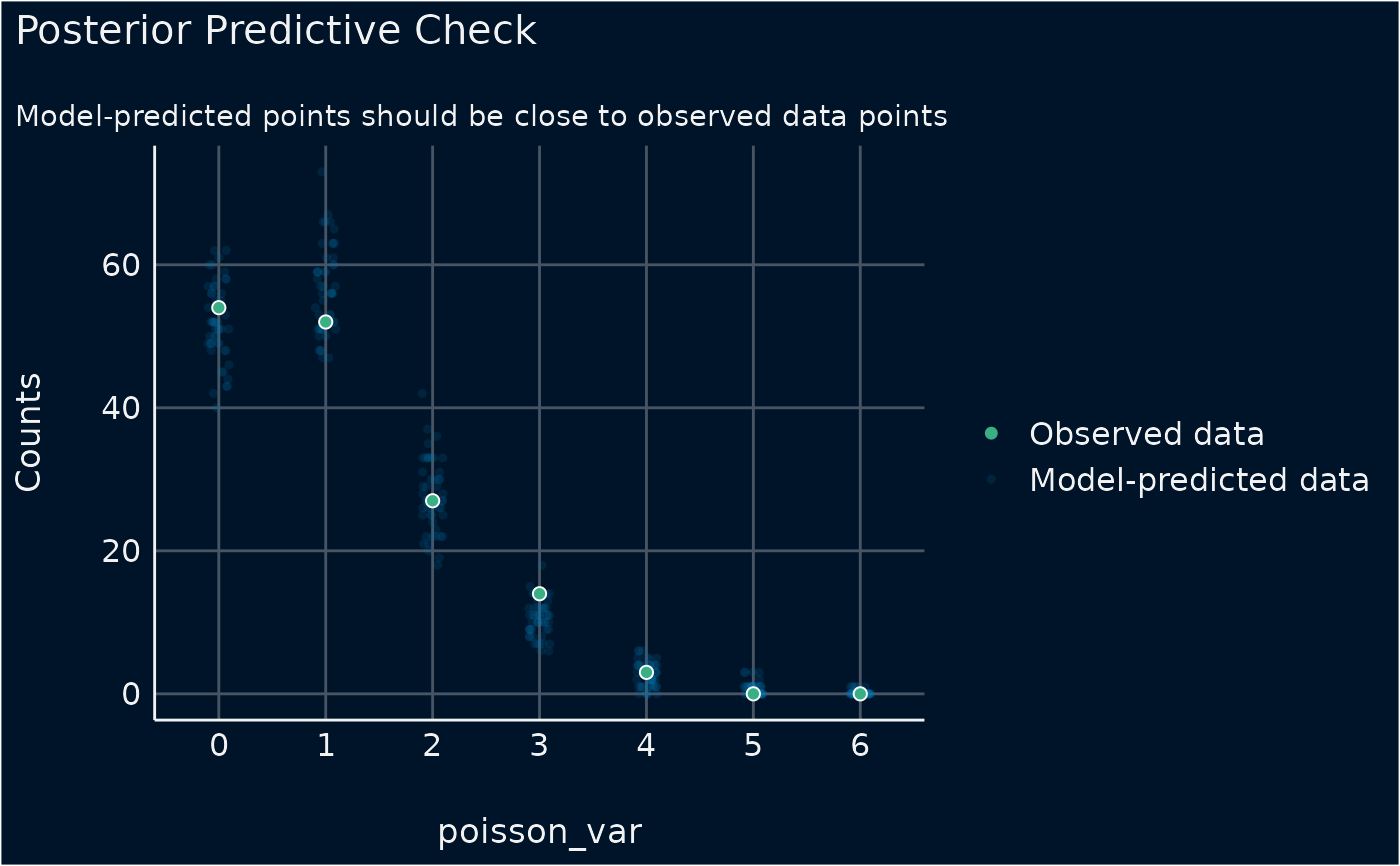
 # dot-plot style for count-models
d <- iris
d$poisson_var <- rpois(150, 1)
model <- glm(
poisson_var ~ Species + Petal.Length + Petal.Width,
data = d,
family = poisson()
)
out <- check_predictions(model)
plot(out, type = "discrete_dots")
#> Ignoring unknown labels:
#> • size : ""
#> • alpha : ""
# dot-plot style for count-models
d <- iris
d$poisson_var <- rpois(150, 1)
model <- glm(
poisson_var ~ Species + Petal.Length + Petal.Width,
data = d,
family = poisson()
)
out <- check_predictions(model)
plot(out, type = "discrete_dots")
#> Ignoring unknown labels:
#> • size : ""
#> • alpha : ""