The plot() method for the bayestestR::si().
Usage
# S3 method for class 'see_si'
plot(
  x,
  color_si = "#0171D3",
  alpha_si = 0.2,
  show_intercept = FALSE,
  support_only = FALSE,
  ...
)
Arguments
- x
An object.
- color_si
Character specifying color of SI ribbon.
- alpha_si
Numeric value specifying Transparency level of SI ribbon.
- show_intercept
Logical, if
TRUE, the intercept-parameter is included in the plot. By default, it is hidden because in many cases the intercept-parameter has a posterior distribution on a very different location, so density curves of posterior distributions for other parameters are hardly visible.- support_only
Logical. Decides whether to plot only the support data, or show the "raw" prior and posterior distributions? Only applies when plotting
bayestestR::si().- ...
Arguments passed to or from other methods.
Examples
library(rstanarm)
library(bayestestR)
set.seed(123)
m <<- suppressWarnings(stan_glm(Sepal.Length ~ Petal.Width * Species, data = iris, refresh = 0))
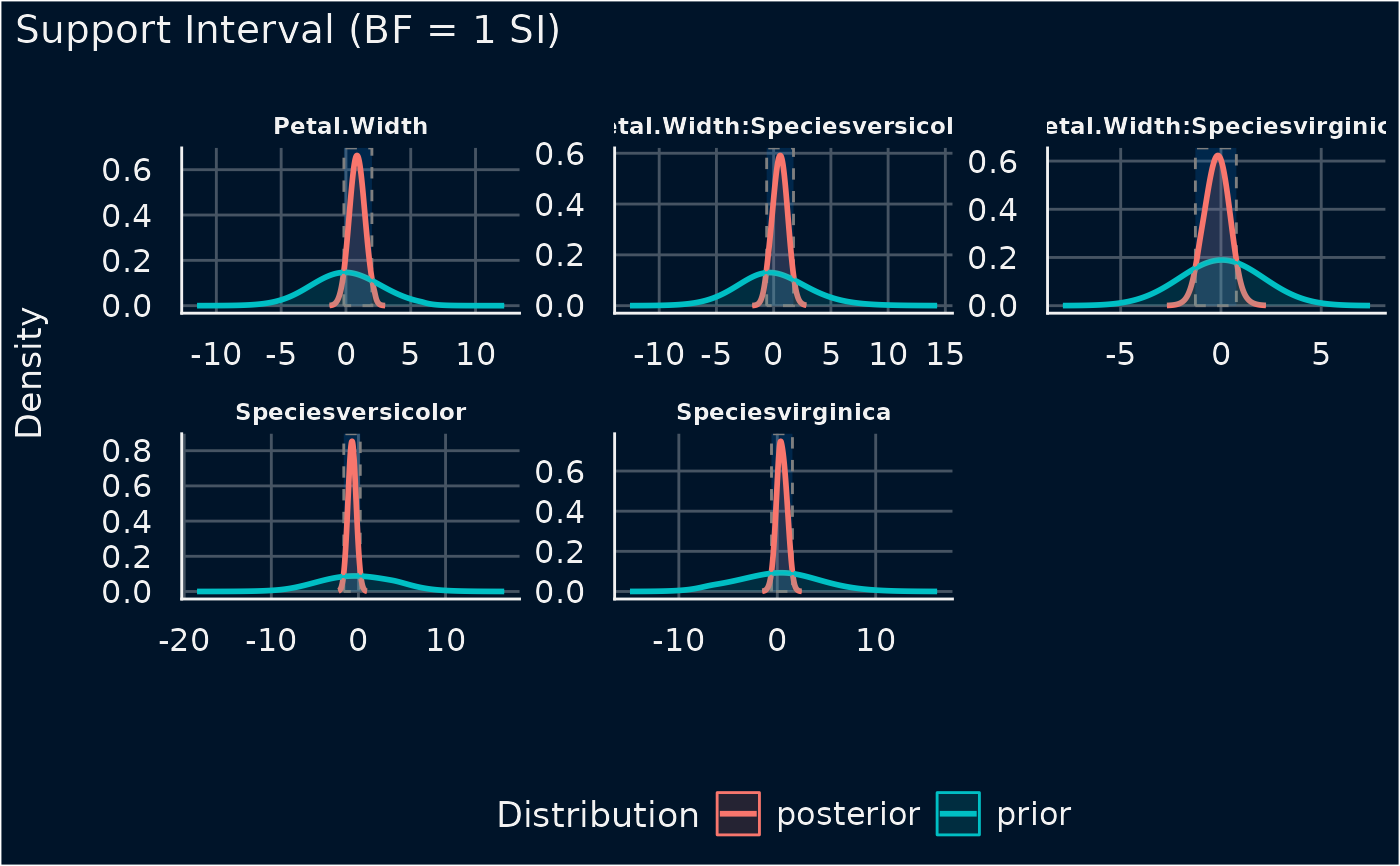
result <- si(m, verbose = FALSE)
result
#> Support Interval
#>
#> Parameter | BF = 1 SI | Effects | Component
#> ---------------------------------------------------------------------
#> (Intercept) | [ 4.39, 5.18] | fixed | conditional
#> Petal.Width | [-0.16, 2.00] | fixed | conditional
#> Speciesversicolor | [-1.68, 0.21] | fixed | conditional
#> Speciesvirginica | [-0.59, 1.54] | fixed | conditional
#> Petal.Width:Speciesversicolor | [-0.61, 1.73] | fixed | conditional
#> Petal.Width:Speciesvirginica | [-1.27, 0.77] | fixed | conditional
plot(result)