Plot method for principal component analysis
Source:R/plot.parameters_pca.R
plot.see_parameters_pca.RdThe plot() method for the parameters::principal_components() function.
Usage
# S3 method for class 'see_parameters_pca'
plot(
  x,
  type = "bar",
  size_text = 3.5,
  color_text = "black",
  colors = c("#cd201f", "#ffffff", "#0077B5"),
  size = 1,
  show_labels = TRUE,
  arrow_end_gap = 0.07,
  factor_node_size = c(25, 35),
  margins = c(0.3, 0.3),
  names_factors = NULL,
  fill_variables = "#738b8d",
  fill_factors = "#2C3E50",
  ...
)
Arguments
- x
An object.
- type
Character vector, indicating the type of plot. Options are different shapes to represent component loadings;
"bar"(default) for a horizontal bar chart,"line"for a horizontal point and line chart, or"graph"for a graph.- size_text
Numeric value specifying size of text labels.
- color_text
Character specifying color of text labels.
- colors
Character vector of length three, indicating the colors for low (negative), mid (close to zero), and high (positive) values.
- size
Depending on
type, a numeric value specifying size of bars, lines, or segments.- show_labels
Logical. If
TRUE, text labels are displayed.- arrow_end_gap
Numeric. Specifies the distance between the tip of the edge arrow and the variable node. Adjusting this value prevents the arrow from overlapping or clipping into the variable label. Default is
0.07(measured in 'snpc' units). This argument is only used iftype = "graph".- factor_node_size
Numeric vector of length 2. Determines the minimum and maximum size of the circular factor nodes. Factor nodes are scaled internally based on the proportion of variance they explain. This argument is only used if
type = "graph".- margins
Numeric vector of length 2. Adds extra space to the left and right edges of the plot canvas (using
ggplot2::expansion). This is particularly useful to prevent long variable labels on the edges from being cut off. This argument is only used iftype = "graph".- names_factors
Named character vector. Allows providing custom labels for the factor nodes. The names of the vector must match the original factor names generated by the model (e.g.,
c("Component 1" = "Extraversion", "Component 2" = "Neuroticism")). This argument is only used iftype = "graph".- fill_variables
Character vector. Specifies the fill color for the variable nodes (rectangular labels). Can be a single color hex/name (applied to all variables), a vector of colors matching the exact number of variables, or a named vector to map specific colors to specific variables. This argument is only used if
type = "graph".- fill_factors
Character vector. Specifies the fill color for the factor nodes (circular points). Similar to
fill_variables, this accepts a single color, a vector of matching length, or a named vector for precise mapping. This argument is only used iftype = "graph".- ...
Arguments passed to or from other methods.
Examples
library(parameters)
data(mtcars)
result <- principal_components(mtcars[, 1:7], n = "all", threshold = 0.2)
result
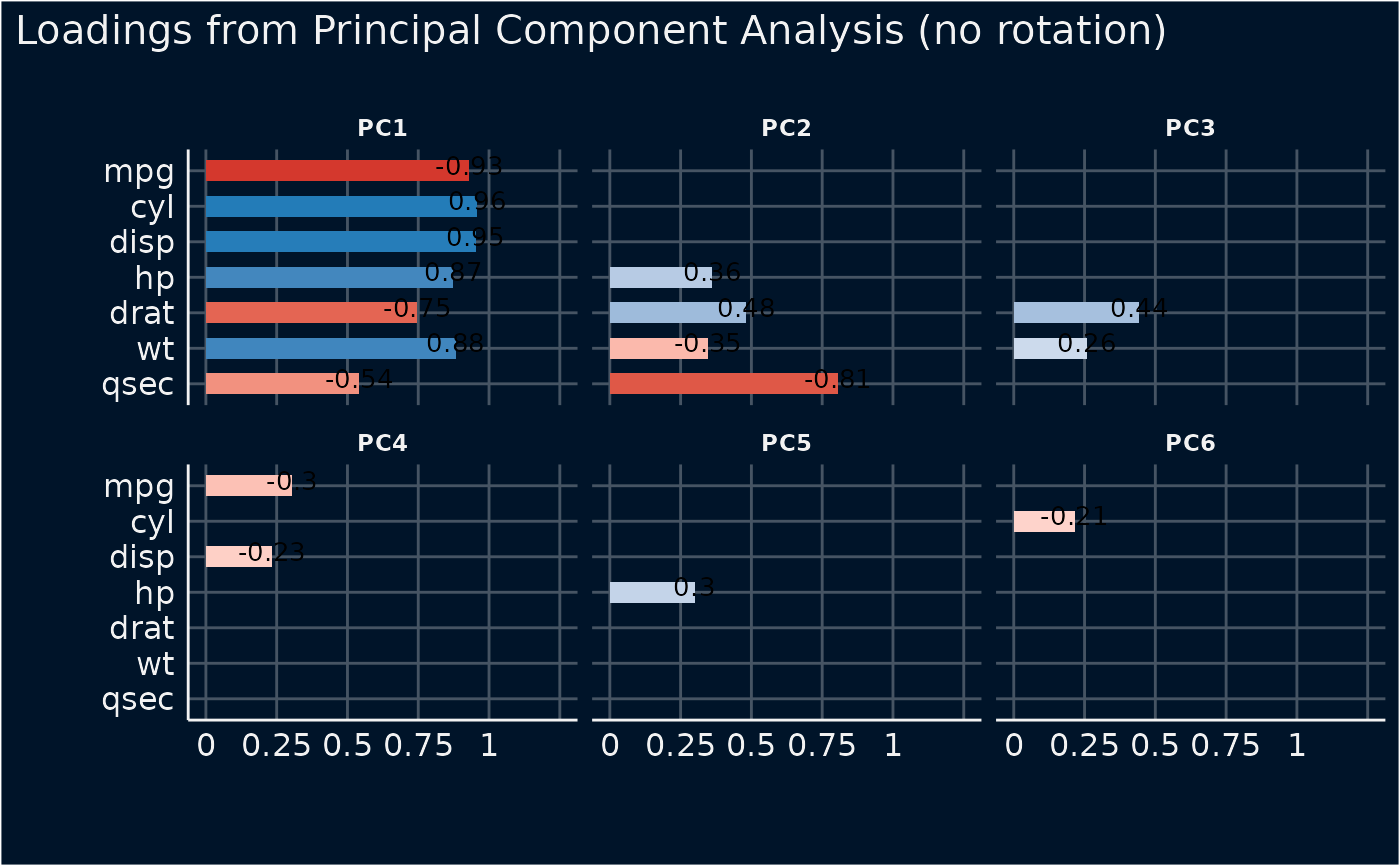
#> # Loadings from Principal Component Analysis (no rotation)
#>
#> Variable | PC1 | PC2 | PC3 | PC4 | PC5 | PC6 | Complexity
#> -------------------------------------------------------------------
#> mpg | -0.93 | | | -0.30 | | | 1.30
#> cyl | 0.96 | | | | | -0.21 | 1.18
#> disp | 0.95 | | | -0.23 | | | 1.16
#> hp | 0.87 | 0.36 | | | 0.30 | | 1.64
#> drat | -0.75 | 0.48 | 0.44 | | | | 2.47
#> wt | 0.88 | -0.35 | 0.26 | | | | 1.54
#> qsec | -0.54 | -0.81 | | | | | 1.96
#>
#> The 6 principal components accounted for 99.30% of the total variance of the original data (PC1 = 72.66%, PC2 = 16.52%, PC3 = 4.93%, PC4 = 2.26%, PC5 = 1.85%, PC6 = 1.08%).
#>
plot(result)