Plot method for describing distributions of vectors
Source:R/plot.describe_distribution.R
plot.see_parameters_distribution.RdThe plot() method for the parameters::describe_distribution()
function.
Arguments
- x
An object.
- dispersion
Logical. If
TRUE, a range of dispersion for each variable to the plot will be added.- alpha_dispersion
Numeric value specifying the transparency level of dispersion ribbon.
- color_dispersion
Character specifying the color of dispersion ribbon.
- dispersion_style
Character describing the style of dispersion area.
"ribbon"for a ribbon,"curve"for a normal-curve.- size_bar
Size of bar geoms.
- highlight
A vector with names of categories in
xthat should be highlighted.- color_highlight
A vector of color values for highlighted categories. The remaining (non-highlighted) categories will be filled with a lighter grey.
- ...
Arguments passed to or from other methods.
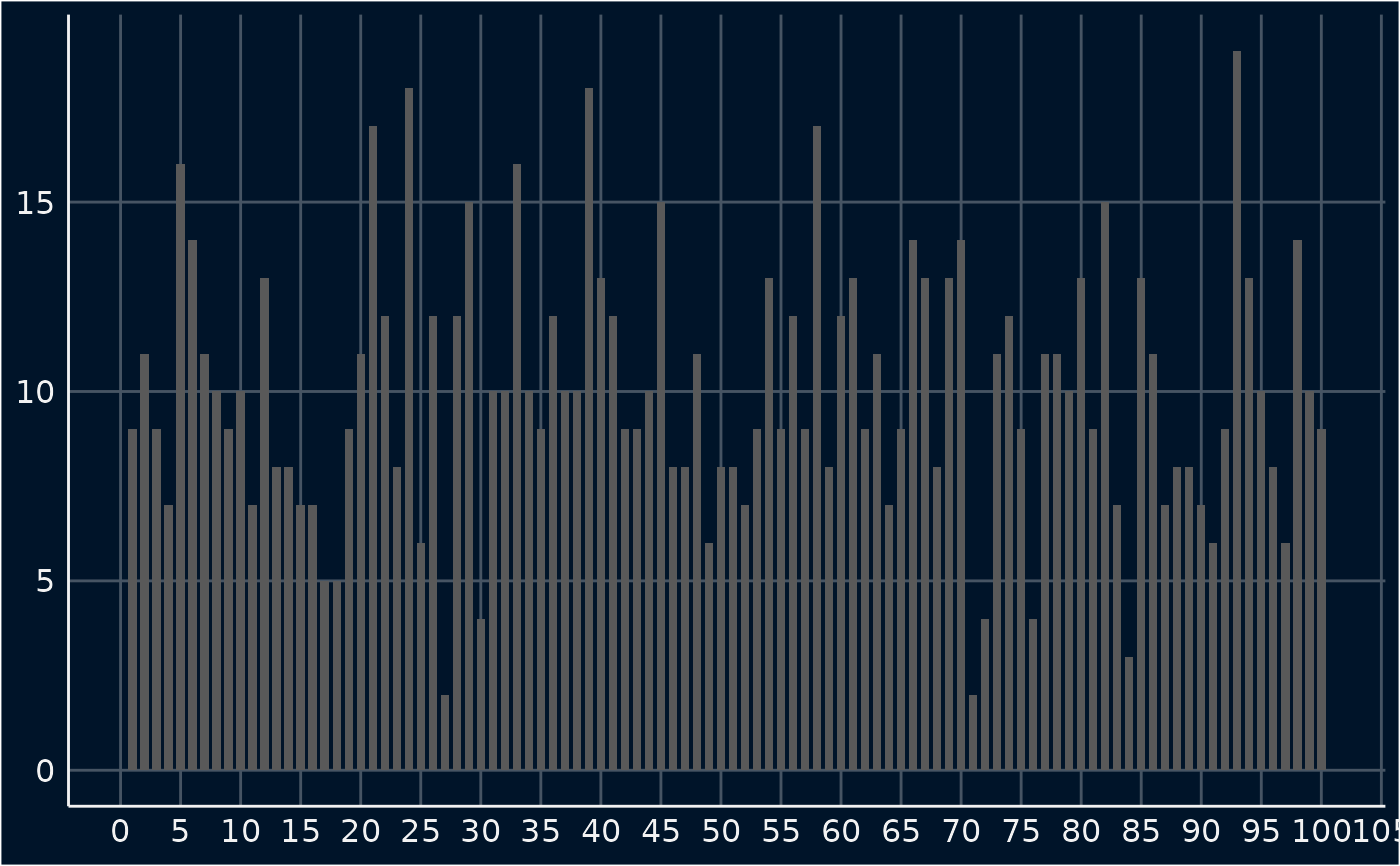
Examples
library(parameters)
set.seed(333)
x <- sample(1:100, 1000, replace = TRUE)
result <- describe_distribution(x)
result
#>  Mean |    SD |   IQR |          Range | Skewness | Kurtosis |    n | n_Missing
#> -------------------------------------------------------------------------------
#> 50.18 | 28.66 | 48.75 | [1.00, 100.00] |     0.02 |    -1.16 | 1000 |         0
plot(result)