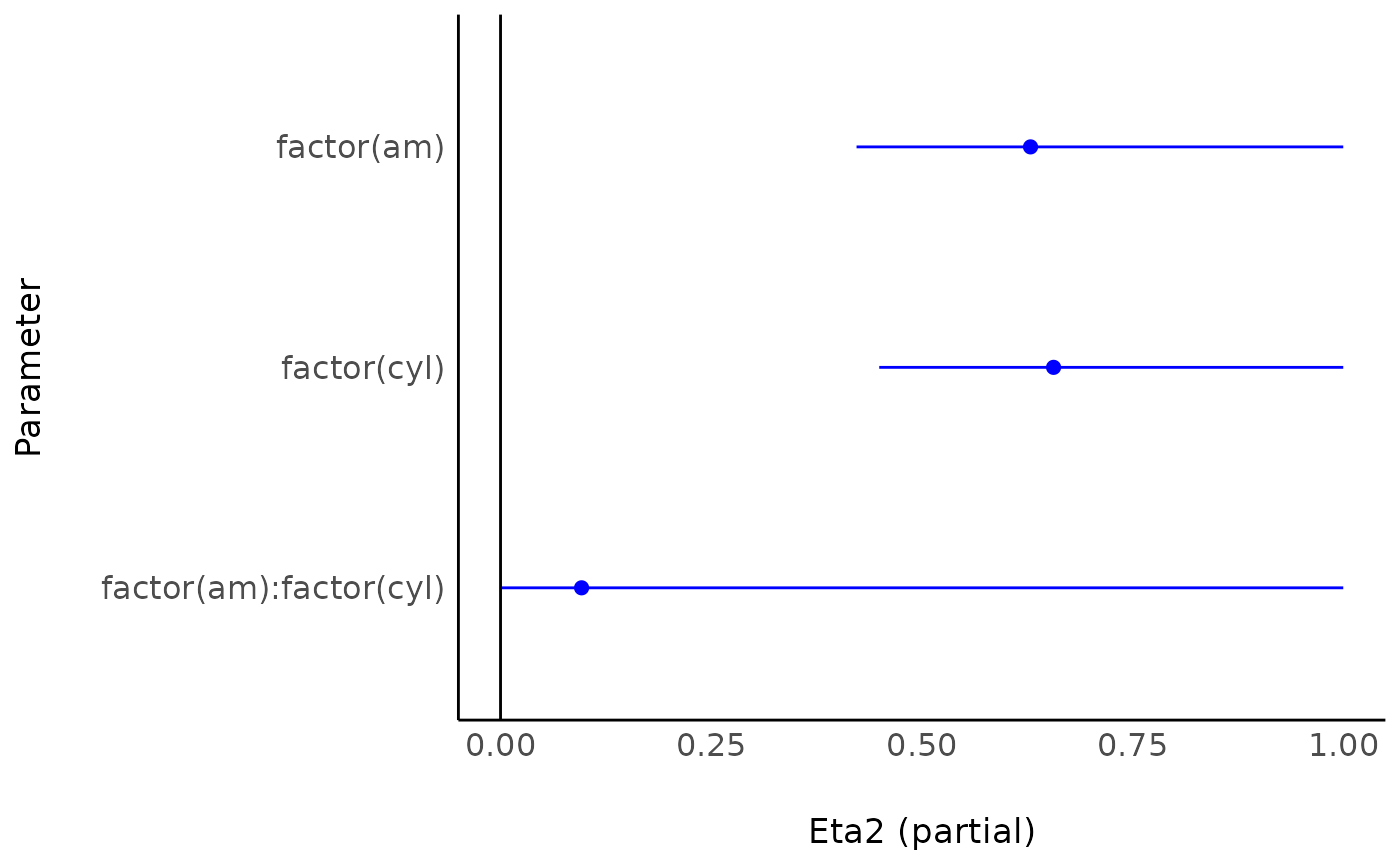
The plot() method for the effectsize::effectsize() function.
Usage
# S3 method for class 'see_effectsize_table'
plot(x, ...)Examples
library(effectsize)
m <- aov(mpg ~ factor(am) * factor(cyl), data = mtcars)
result <- eta_squared(m)
plot(result)

