Plot method for comparing model performances
Source:R/plot.compare_performance.R
plot.see_compare_performance.RdThe plot() method for the performance::compare_performance() function.
Usage
# S3 method for class 'see_compare_performance'
plot(x, size_line = 1, ...)Examples
library(performance)
data(iris)
lm1 <- lm(Sepal.Length ~ Species, data = iris)
lm2 <- lm(Sepal.Length ~ Species + Petal.Length, data = iris)
lm3 <- lm(Sepal.Length ~ Species * Petal.Length, data = iris)
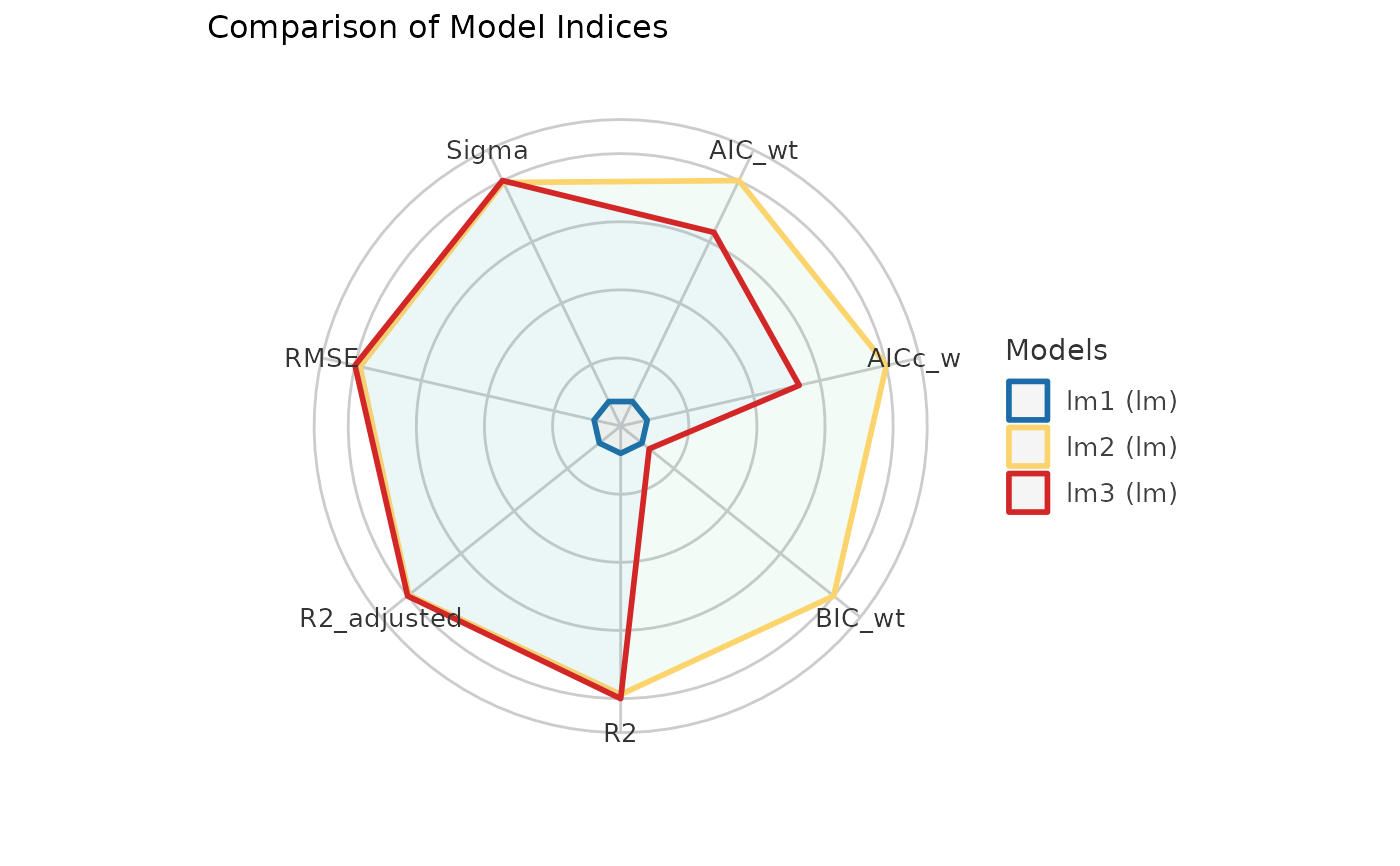
result <- compare_performance(lm1, lm2, lm3)
result
#> # Comparison of Model Performance Indices
#>
#> Name | Model | AIC (weights) | AICc (weights) | BIC (weights) | R2
#> ---------------------------------------------------------------------
#> lm1 | lm | 231.5 (<.001) | 231.7 (<.001) | 243.5 (<.001) | 0.619
#> lm2 | lm | 106.2 (0.566) | 106.6 (0.611) | 121.3 (0.964) | 0.837
#> lm3 | lm | 106.8 (0.434) | 107.6 (0.389) | 127.8 (0.036) | 0.840
#>
#> Name | R2 (adj.) | RMSE | Sigma
#> --------------------------------
#> lm1 | 0.614 | 0.510 | 0.515
#> lm2 | 0.833 | 0.333 | 0.338
#> lm3 | 0.835 | 0.330 | 0.336
plot(result)