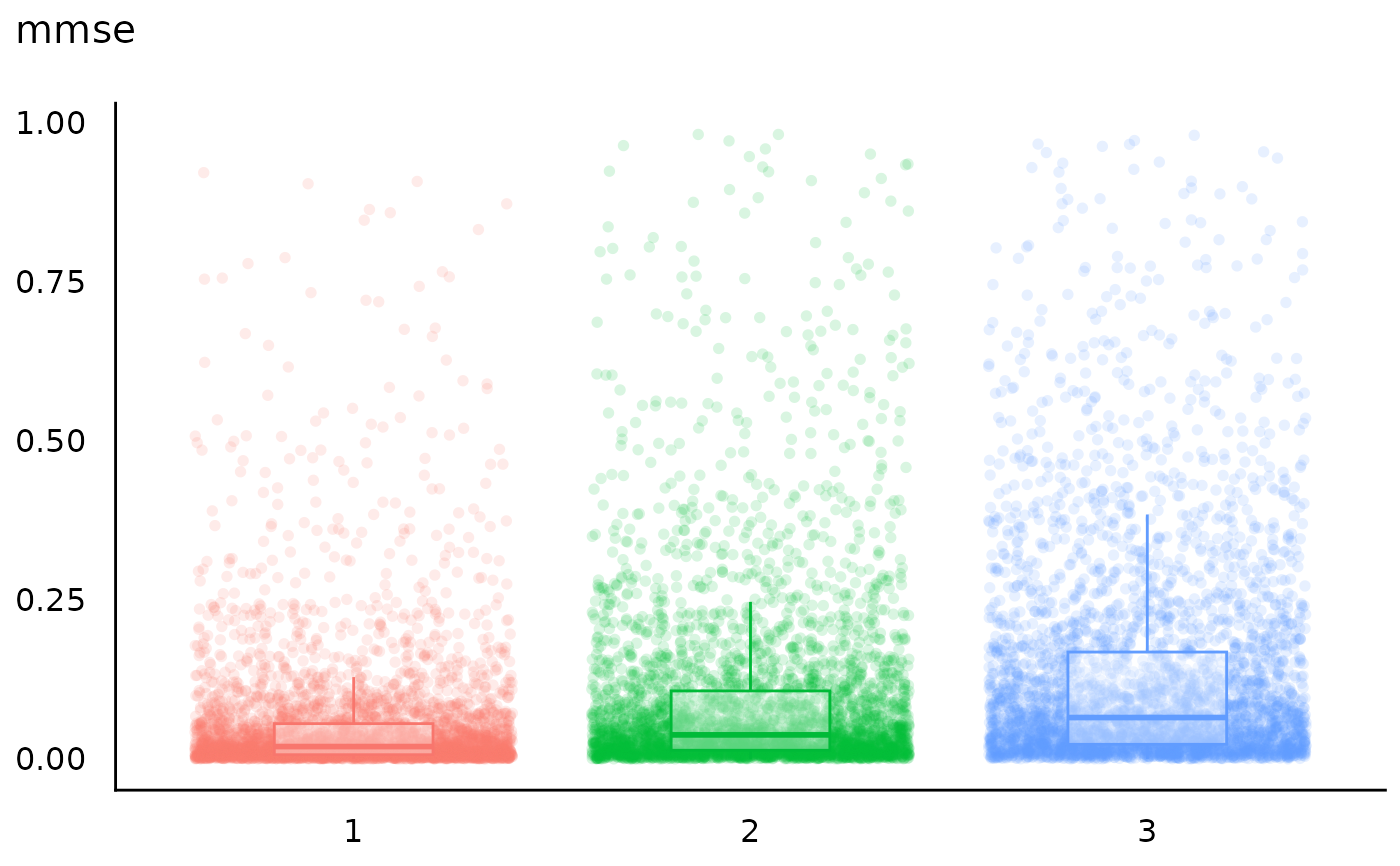
The plot() method for the performance::check_priors() function. For
details, see Lüdecke et al. 2026.
Usage
# S3 method for class 'see_check_priors'
plot(
  x,
  size_point = 2,
  size_boxplot = 0.4,
  size_title = 12,
  size_axis_title = base_size,
  base_size = 10,
  alpha_dot = 0.15,
  alpha_boxplot = 0.35,
  theme = NULL,
  ...
)
Arguments
- x
An object.
- size_point
Numeric specifying size of point-geoms.
- size_boxplot
Numeric value specifying size of boxplot geoms.
- base_size, size_axis_title, size_title
Numeric value specifying size of axis and plot titles.
- alpha_dot
Numeric value specifying alpha level of the point geoms.
- alpha_boxplot
Numeric value specifying alpha of boxplot geoms.
- theme
A ggplot2-theme function, e.g.
theme = theme_lucid()ortheme = ggplot2::theme_dark().- ...
Arguments passed to or from other methods.
References
Lüdecke D, Makowski AC, Klein J, Ben-Shachar MS and Makowski D (2026) Choosing informative priors in Bayesian regression models: a simulation study and tutorial using Stan and R. Front. Psychol. 17:1856582. doi:10.3389/fpsyg.2026.1856582
Examples
# \dontrun{
library(performance)
# model with correctly defined priors. outcome is binary, prior
# predictive checks indicate the predicted probability mass based
# on the prior distributions - the resulting pattern aligns with
# our real-world assumptions
model <- insight::download_model("stan_prior_checks_1")
plot(performance::check_priors(model, "mmse"))
 # model with default (weakly informative) priors, which is poorly
# calibrated. It pushes probability mass almost exclusively to the
# extremes of 0 and 1, leaving the plausible middle range largely
# unsupported
model <- insight::download_model("stan_prior_checks_2")
plot(performance::check_priors(model, "mmse"))
# model with default (weakly informative) priors, which is poorly
# calibrated. It pushes probability mass almost exclusively to the
# extremes of 0 and 1, leaving the plausible middle range largely
# unsupported
model <- insight::download_model("stan_prior_checks_2")
plot(performance::check_priors(model, "mmse"))
 # }
# }