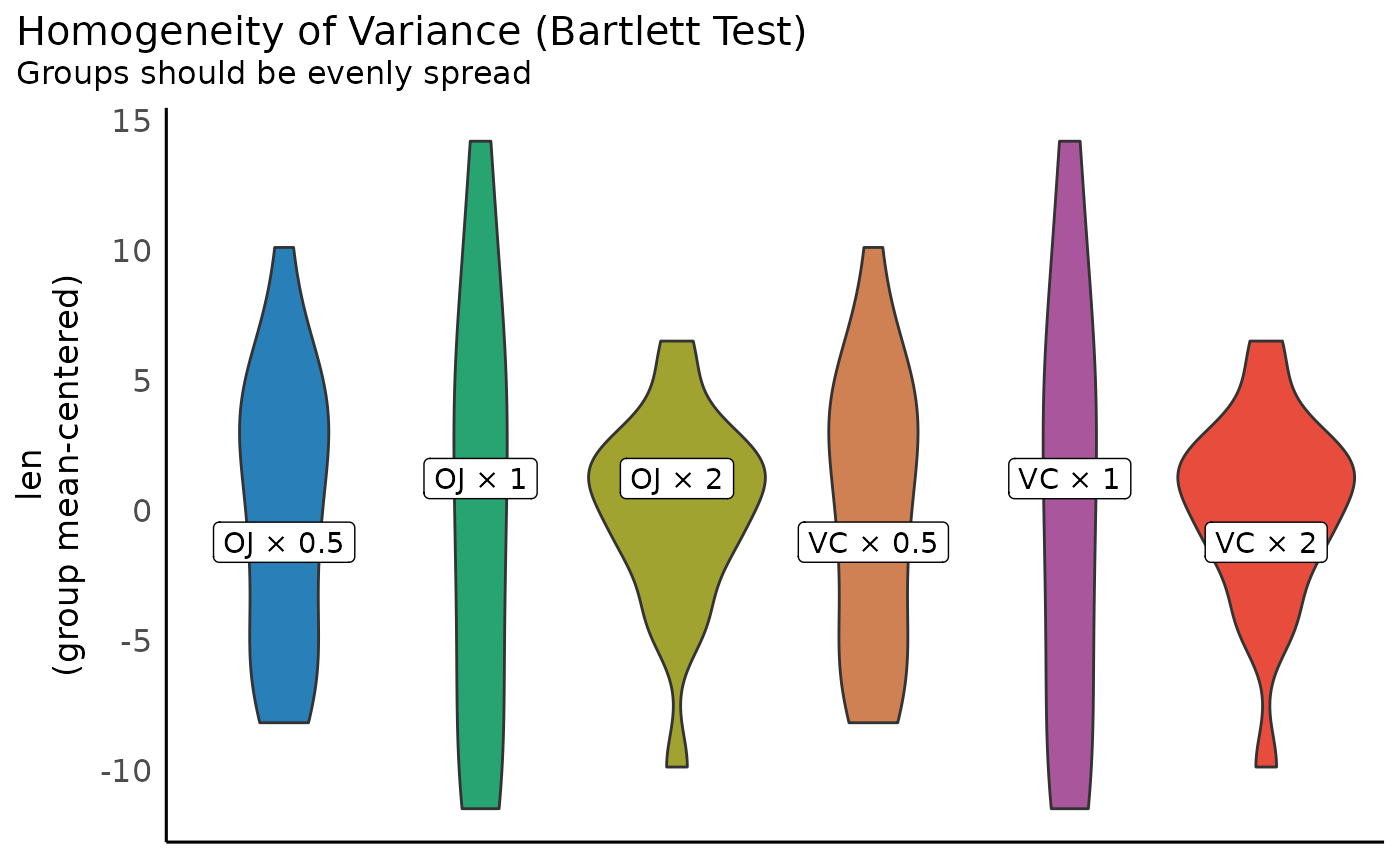
Plot method for homogeneity of variances checks
Source:R/plot.check_homogeneity.R
plot.see_check_homogeneity.RdThe plot() method for the performance::check_homogeneity()
function.
Usage
# S3 method for class 'see_check_homogeneity'
plot(x, data = NULL, ...)Examples
library(performance)

model <<- lm(len ~ supp + dose, data = ToothGrowth)
result <- check_homogeneity(model)
result
#> OK: There is not clear evidence for different variances across groups (Bartlett Test, p = 0.226).
#>
plot(result)
