Plot method for multicollinearity checks
Source:R/plot.check_collinearity.R
plot.see_check_collinearity.RdThe plot() method for the performance::check_collinearity() function.
Arguments
- x
An object.
- data
The original data used to create this object. Can be a statistical model.
- theme
A ggplot2-theme function, e.g.
theme = theme_lucid()ortheme = ggplot2::theme_dark().- colors
Character vector of length two, indicating the colors (in hex-format) for points and line.
- size_point
Numeric specifying size of point-geoms.
- size_line
Numeric value specifying size of line geoms.
- base_size, size_axis_title, size_title
Numeric value specifying size of axis and plot titles.
- ...
Arguments passed to or from other methods.
Examples
library(performance)
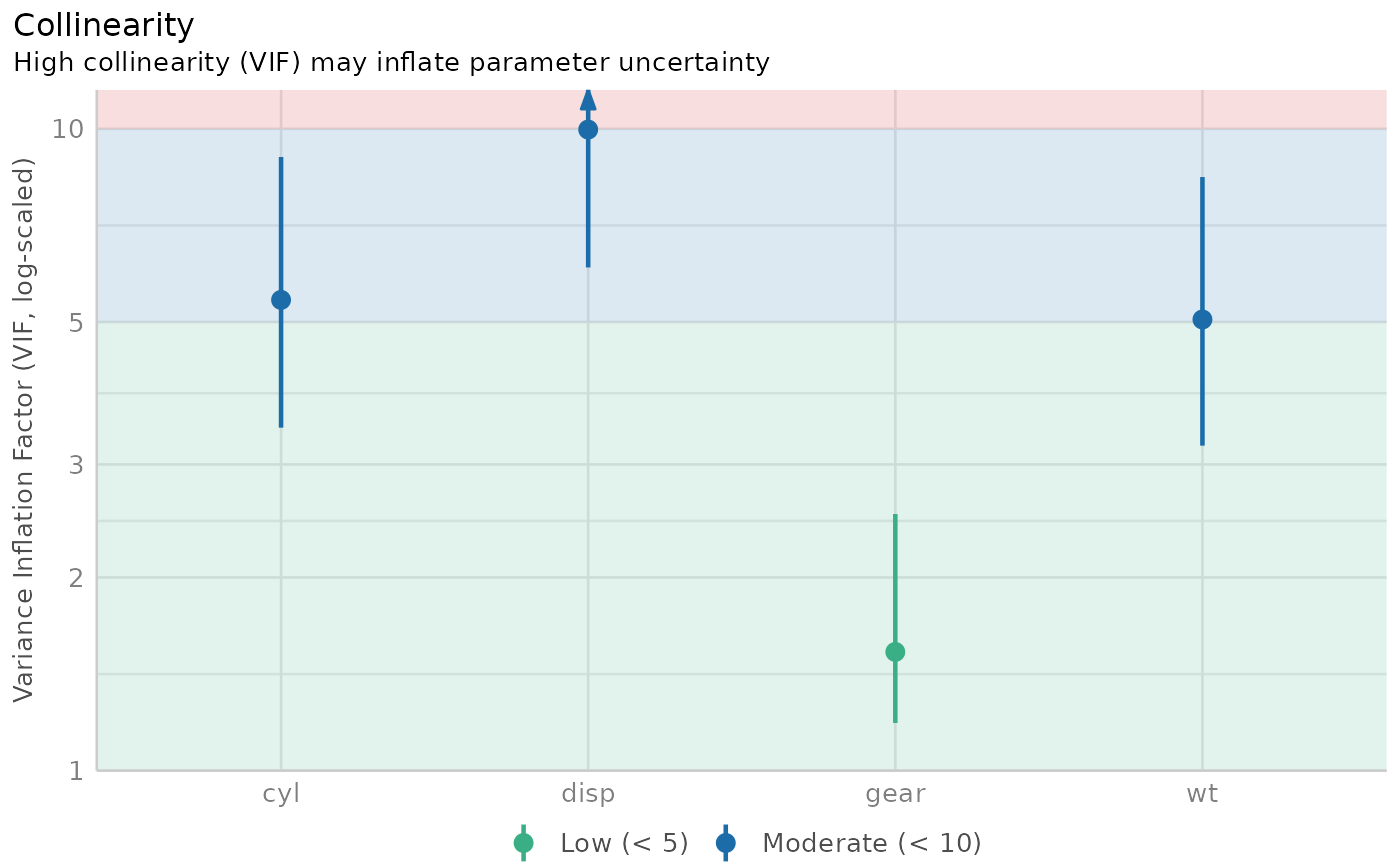
m <- lm(mpg ~ wt + cyl + gear + disp, data = mtcars)
result <- check_collinearity(m)
result
#> # Check for Multicollinearity
#>
#> Low Correlation
#>
#> Term VIF VIF 95% CI adj. VIF Tolerance Tolerance 95% CI
#> gear 1.53 [1.19, 2.51] 1.24 0.65 [0.40, 0.84]
#>
#> Moderate Correlation
#>
#> Term VIF VIF 95% CI adj. VIF Tolerance Tolerance 95% CI
#> wt 5.05 [3.21, 8.41] 2.25 0.20 [0.12, 0.31]
#> cyl 5.41 [3.42, 9.04] 2.33 0.18 [0.11, 0.29]
#> disp 9.97 [6.08, 16.85] 3.16 0.10 [0.06, 0.16]
plot(result)