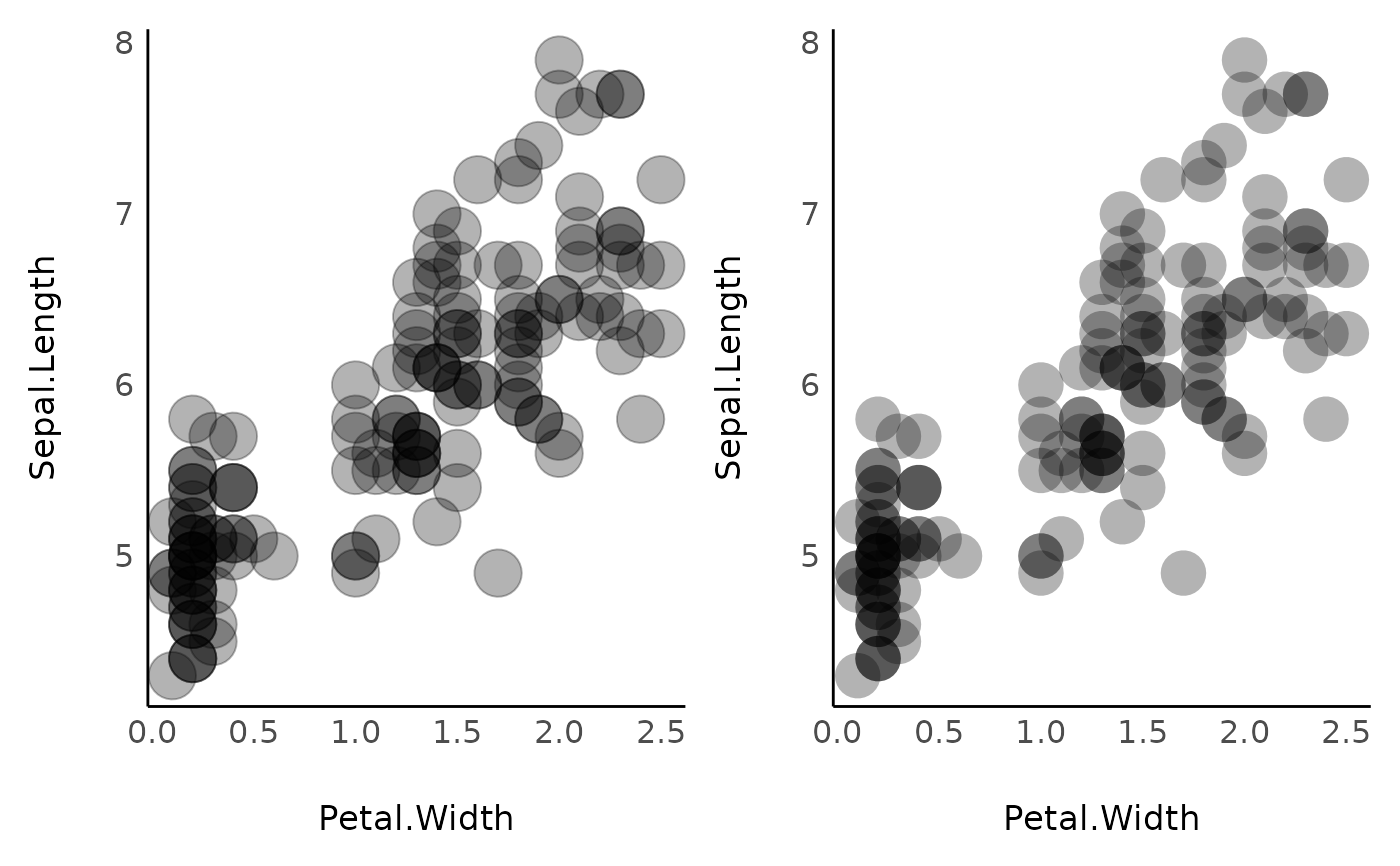
The *_borderless geoms (and their shortcuts ending in 2, such as geom_point2
or geom_point_borderless) render points without an outline stroke by default.
This prevents harsh edges and yields a smoother, cleaner look, especially when
using transparency.
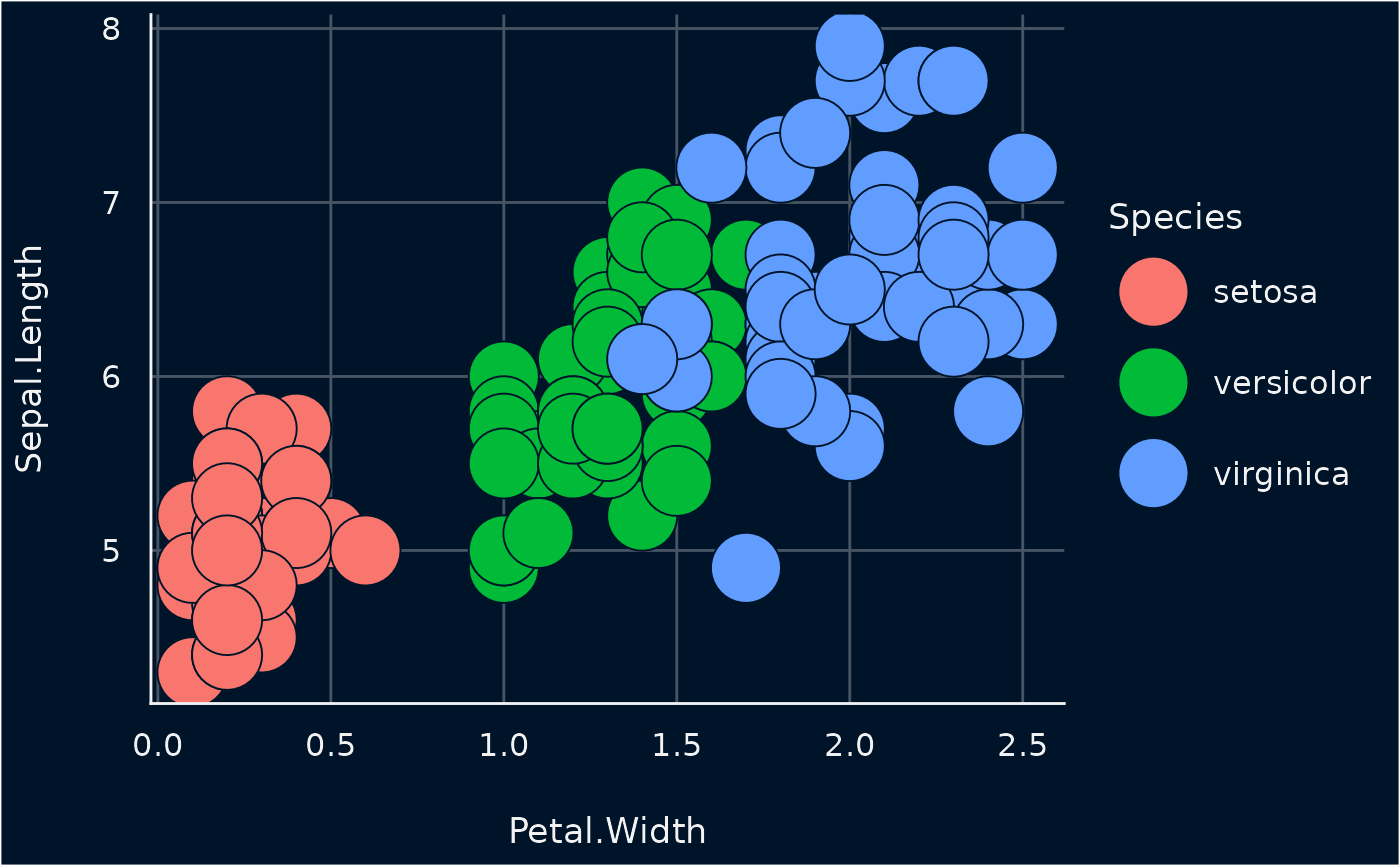
In contrast, the *_halo variants feature a border that automatically matches
the plot's background color. This creates a subtle visual separation (a "halo"
effect) that keeps overlapping points distinct.
Usage
geom_point2(..., stroke = 0, shape = 16)

geom_jitter2(..., size = 2, stroke = 0, shape = 16)

geom_pointrange2(..., stroke = 0)

geom_count2(..., stroke = 0)

geom_count_borderless(..., stroke = 0)

geom_point_borderless(..., stroke = 0, shape = 16)

geom_jitter_borderless(..., size = 2, stroke = 0, shape = 16)

geom_pointrange_borderless(..., stroke = 0)

geom_point_halo(...)

geom_jitter_halo(...)

geom_count_halo(...)

geom_pointrange_halo(...)
Arguments
- ...
Other arguments to be passed to
ggplot2::geom_point(),ggplot2::geom_jitter(),ggplot2::geom_pointrange(), orggplot2::geom_count().- stroke
Stroke thickness.
- shape
Shape of points.
- size
Size of points.
Examples
library(ggplot2)
library(see)
normal <- ggplot(iris, aes(x = Petal.Width, y = Sepal.Length)) +
geom_point(size = 8, alpha = 0.3) +
theme_modern()
new <- ggplot(iris, aes(x = Petal.Width, y = Sepal.Length)) +
geom_point2(size = 8, alpha = 0.3) +
theme_modern()
plots(normal, new, n_columns = 2)
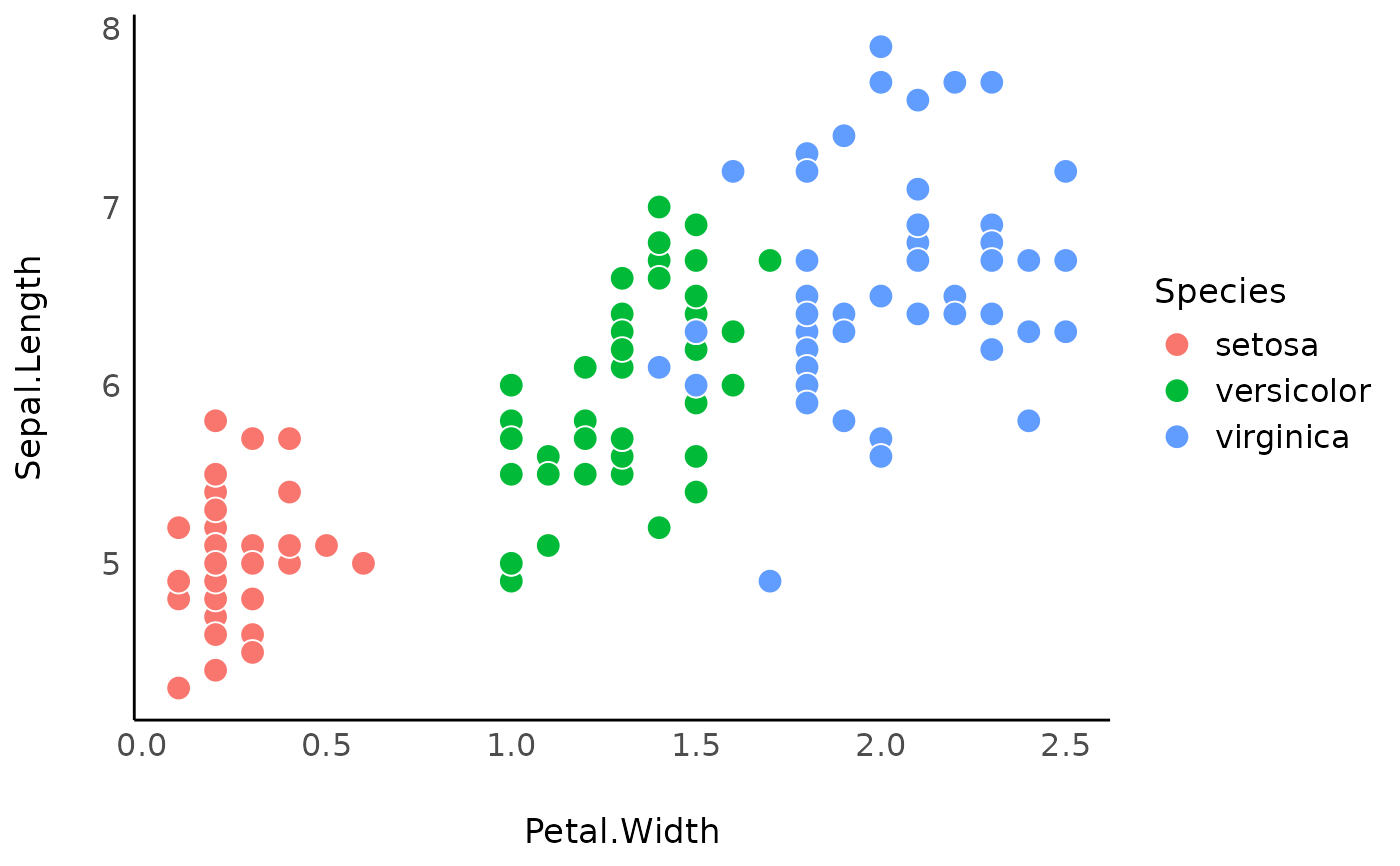
 ggplot(iris, aes(x = Petal.Width, y = Sepal.Length, color = Species)) +
geom_point_borderless(size = 4) +
theme_modern()
ggplot(iris, aes(x = Petal.Width, y = Sepal.Length, color = Species)) +
geom_point_borderless(size = 4) +
theme_modern()
 theme_set(theme_abyss())
ggplot(iris, aes(x = Petal.Width, y = Sepal.Length, color = Species)) +
geom_point_borderless(size = 4)
theme_set(theme_abyss())
ggplot(iris, aes(x = Petal.Width, y = Sepal.Length, color = Species)) +
geom_point_borderless(size = 4)
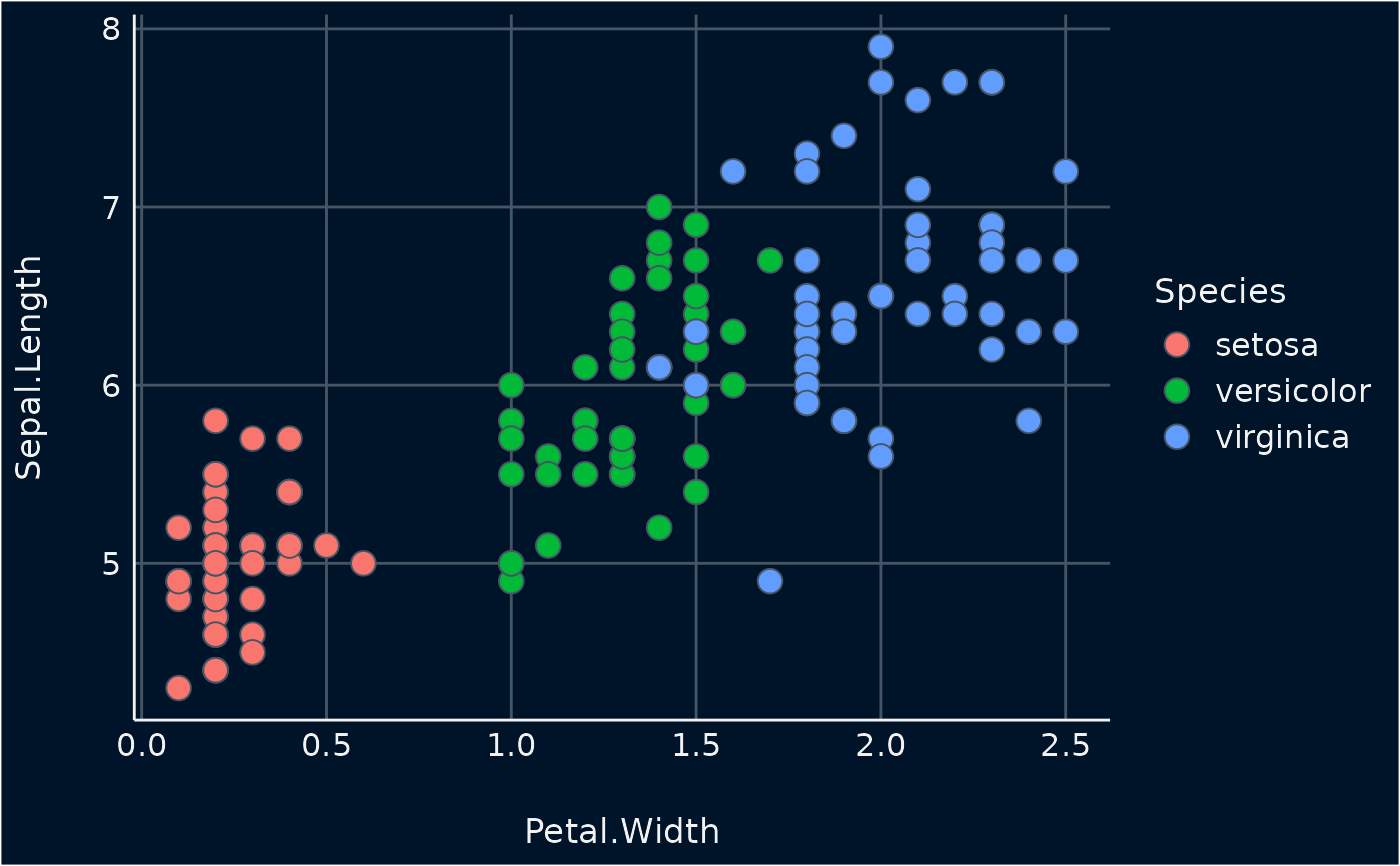 # add "halo" effect - note that the aesthetics is "fill", not "color"
theme_set(theme_abyss())
ggplot(iris, aes(x = Petal.Width, y = Sepal.Length, fill = Species)) +
geom_point_halo(size = 12)
# add "halo" effect - note that the aesthetics is "fill", not "color"
theme_set(theme_abyss())
ggplot(iris, aes(x = Petal.Width, y = Sepal.Length, fill = Species)) +
geom_point_halo(size = 12)