These helper functions are built on top of ggplot2::layer() and can be
used to add geom(s), whose type and content are specified as a list.
Arguments
- x
A list containing:
a geom type (e.g.
geom = "point"),a list of aesthetics (e.g.
aes = list(x = "mpg", y = "wt")),some data (e.g.
data = mtcars),and some other parameters.
For
geoms_from_list()("geoms" with an "s"), the input must be a list of lists, ideally named"l1", "l2", "l3", etc.- ...
Additional arguments passed to
ggplot2::layer().
Examples
library(ggplot2)
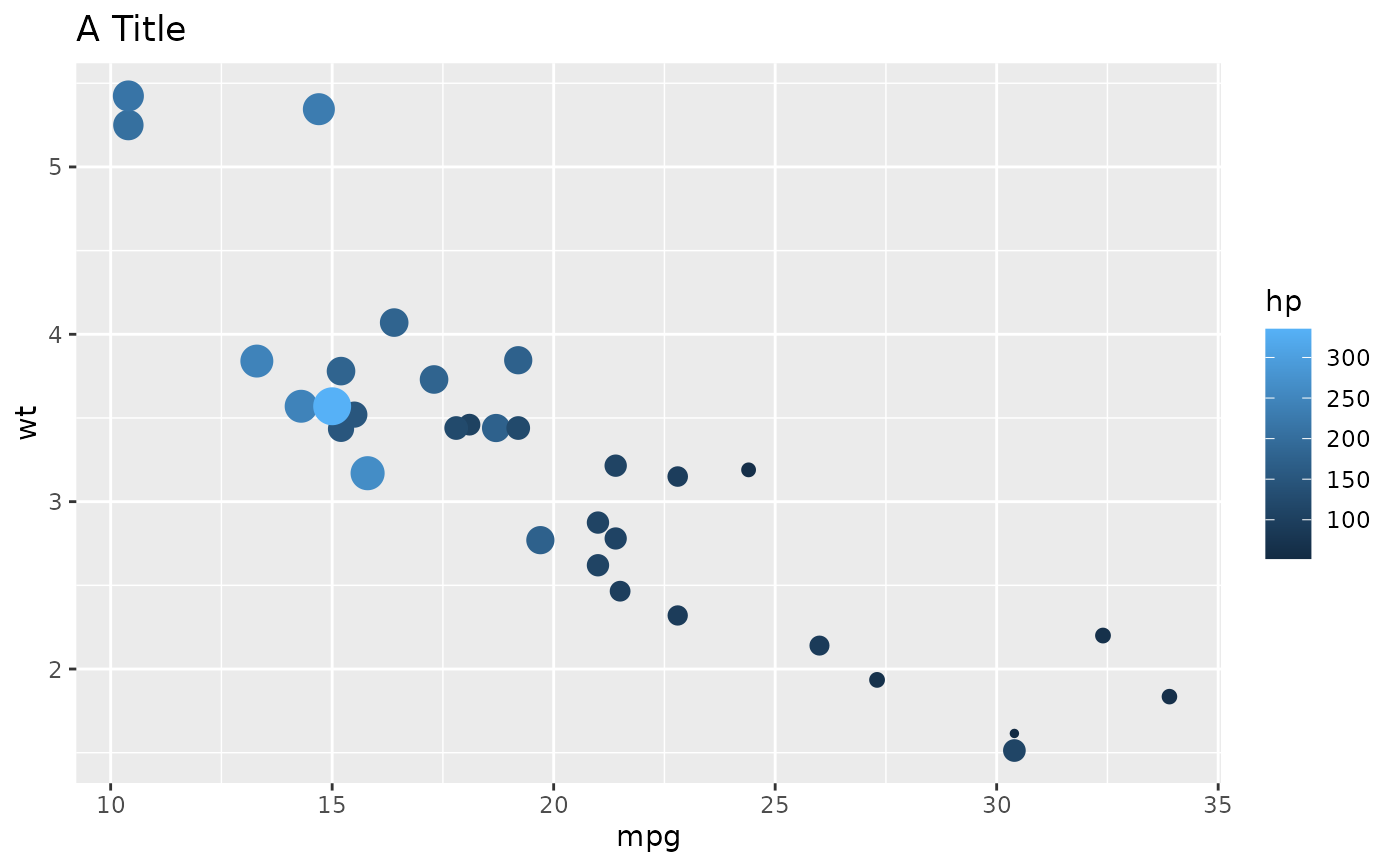
# Example 1 (basic geoms and labels) --------------------------
l1 <- list(
geom = "point",
data = mtcars,
aes = list(x = "mpg", y = "wt", size = "hp", color = "hp"),
show.legend = c("size" = FALSE)
)
l2 <- list(
geom = "labs",
title = "A Title"
)
ggplot() +
geom_from_list(l1) +
geom_from_list(l2)
 ggplot() +
geoms_from_list(list(l1 = l1, l2 = l2))
ggplot() +
geoms_from_list(list(l1 = l1, l2 = l2))
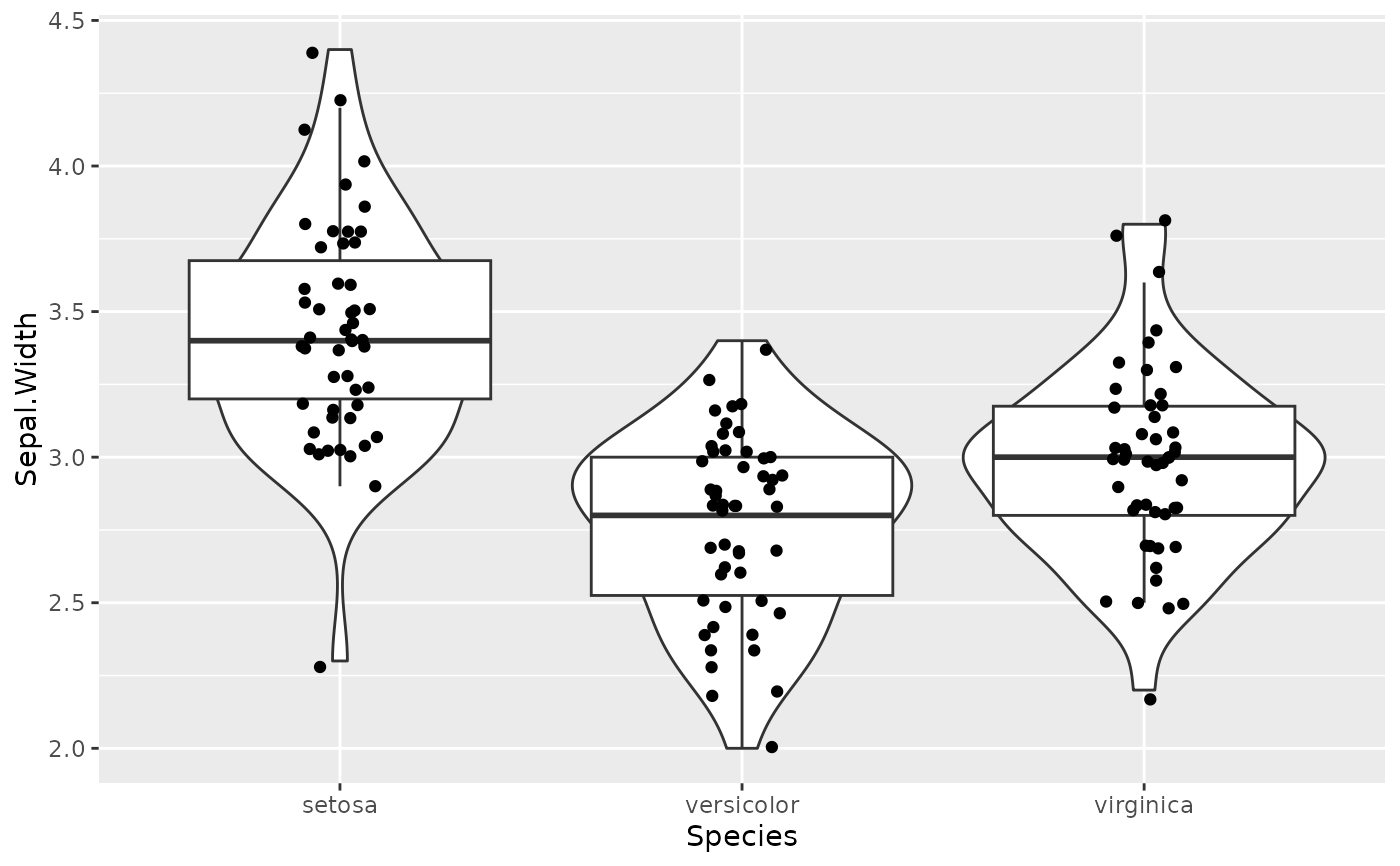
 # Example 2 (Violin, boxplots, ...) --------------------------
l1 <- list(
geom = "violin",
data = iris,
aes = list(x = "Species", y = "Sepal.Width")
)
l2 <- list(
geom = "boxplot",
data = iris,
aes = list(x = "Species", y = "Sepal.Width")
)
l3 <- list(
geom = "jitter",
data = iris,
width = 0.1,
aes = list(x = "Species", y = "Sepal.Width")
)
ggplot() +
geom_from_list(l1) +
geom_from_list(l2) +
geom_from_list(l3)
# Example 2 (Violin, boxplots, ...) --------------------------
l1 <- list(
geom = "violin",
data = iris,
aes = list(x = "Species", y = "Sepal.Width")
)
l2 <- list(
geom = "boxplot",
data = iris,
aes = list(x = "Species", y = "Sepal.Width")
)
l3 <- list(
geom = "jitter",
data = iris,
width = 0.1,
aes = list(x = "Species", y = "Sepal.Width")
)
ggplot() +
geom_from_list(l1) +
geom_from_list(l2) +
geom_from_list(l3)
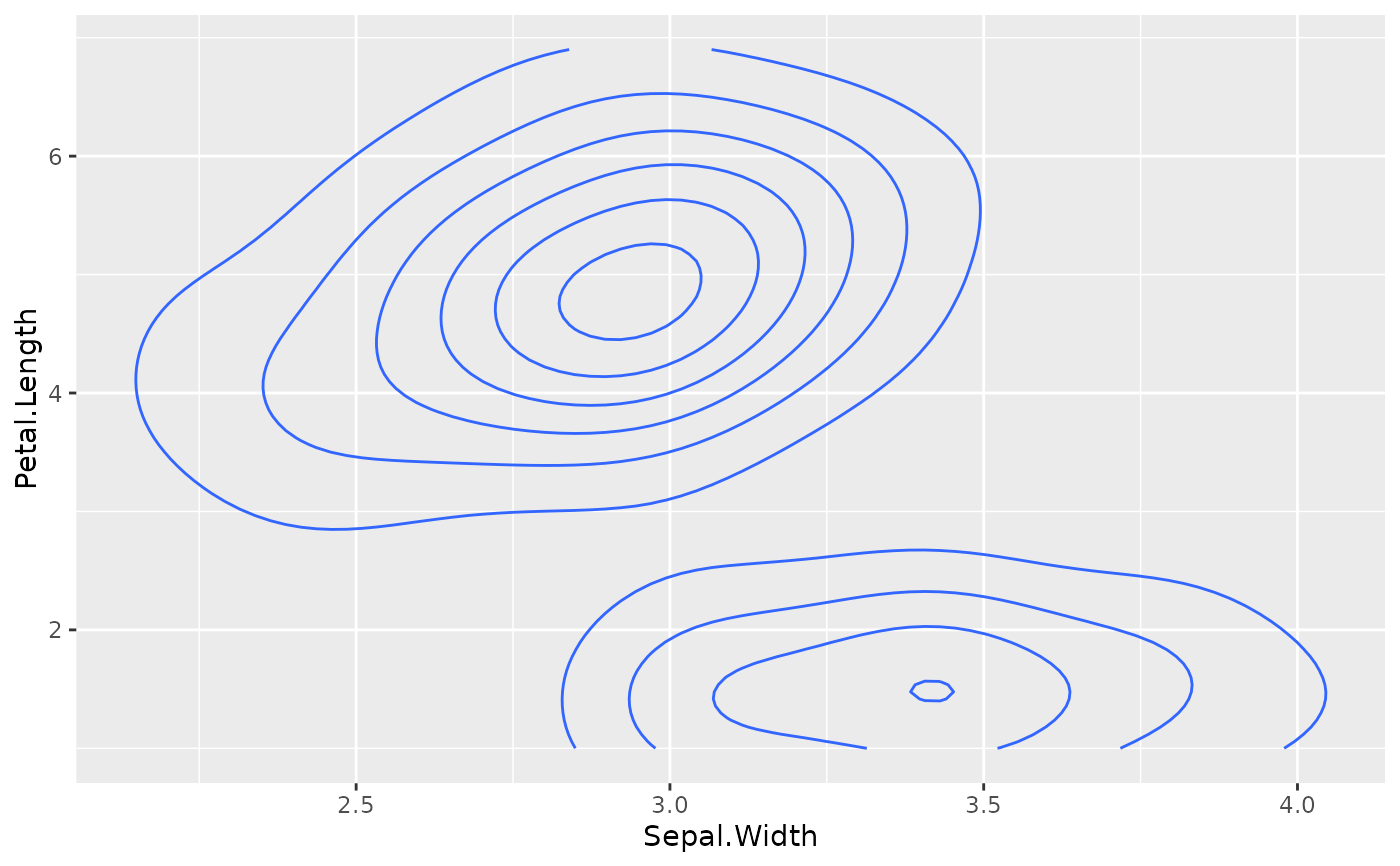
 # Example 3 (2D density) --------------------------
ggplot() +
geom_from_list(list(
geom = "density_2d", data = iris,
aes = list(x = "Sepal.Width", y = "Petal.Length")
))
# Example 3 (2D density) --------------------------
ggplot() +
geom_from_list(list(
geom = "density_2d", data = iris,
aes = list(x = "Sepal.Width", y = "Petal.Length")
))
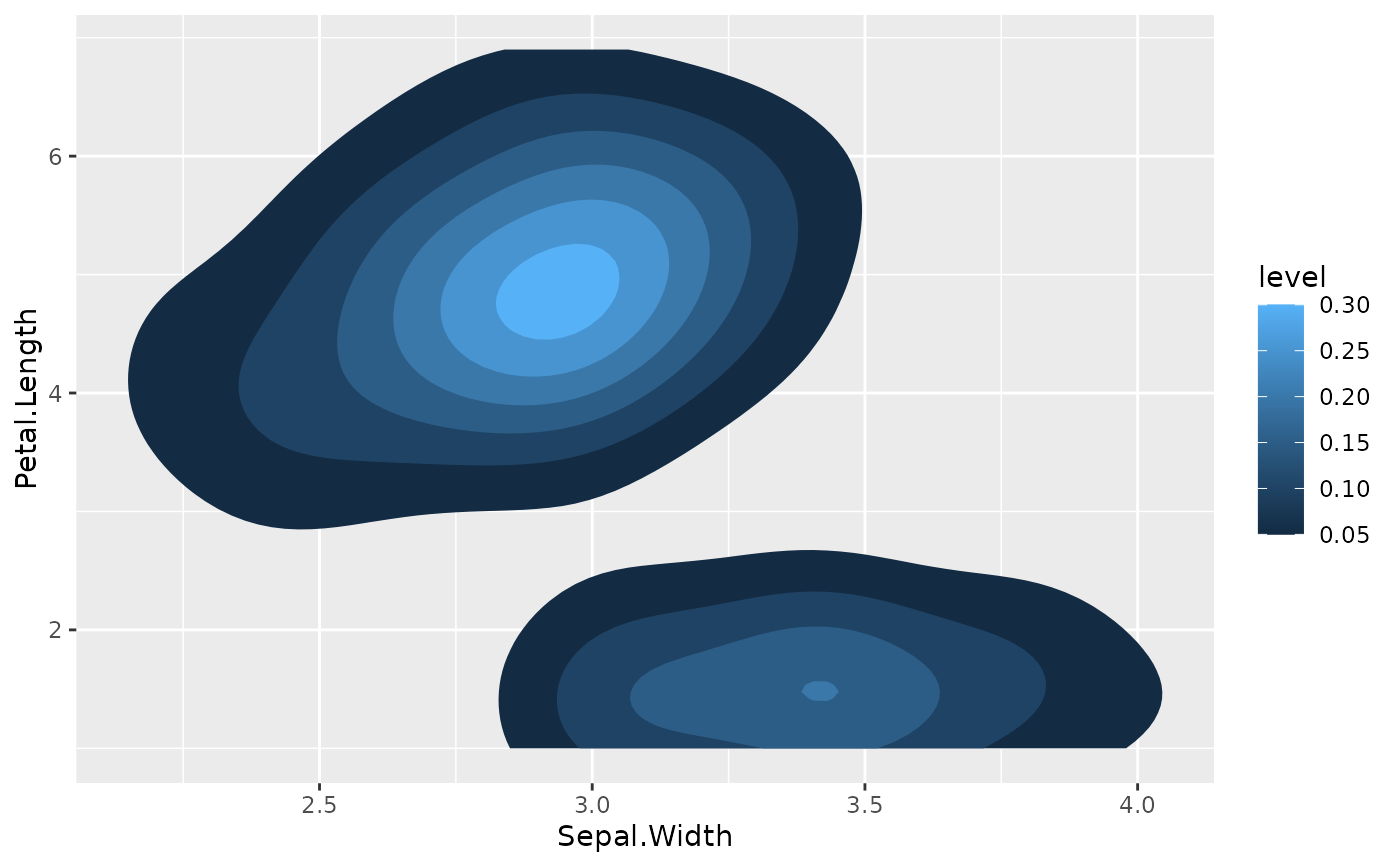
 ggplot() +
geom_from_list(list(
geom = "density_2d_filled", data = iris,
aes = list(x = "Sepal.Width", y = "Petal.Length")
))
ggplot() +
geom_from_list(list(
geom = "density_2d_filled", data = iris,
aes = list(x = "Sepal.Width", y = "Petal.Length")
))
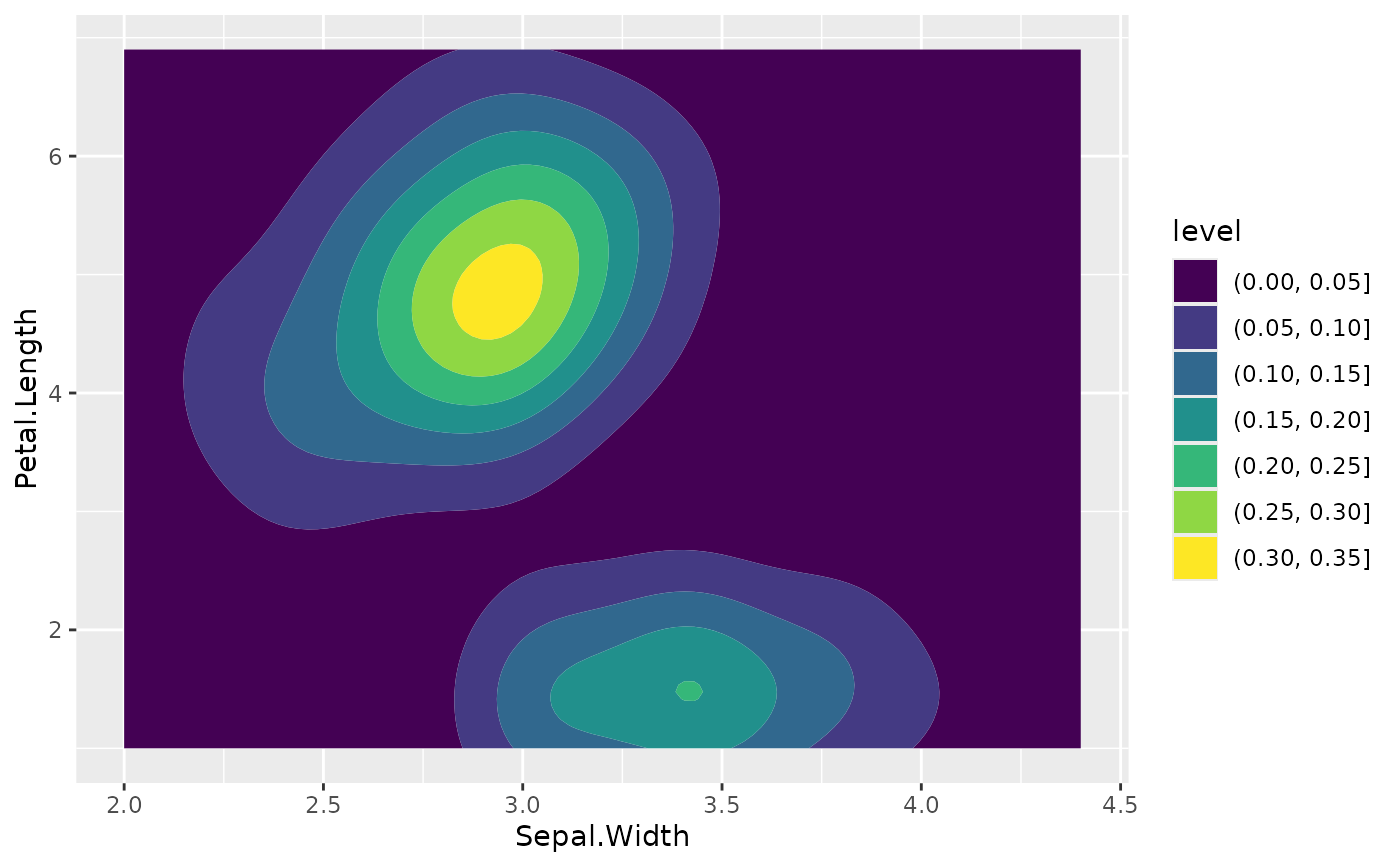 ggplot() +
geom_from_list(list(
geom = "density_2d_polygon", data = iris,
aes = list(x = "Sepal.Width", y = "Petal.Length")
))
ggplot() +
geom_from_list(list(
geom = "density_2d_polygon", data = iris,
aes = list(x = "Sepal.Width", y = "Petal.Length")
))
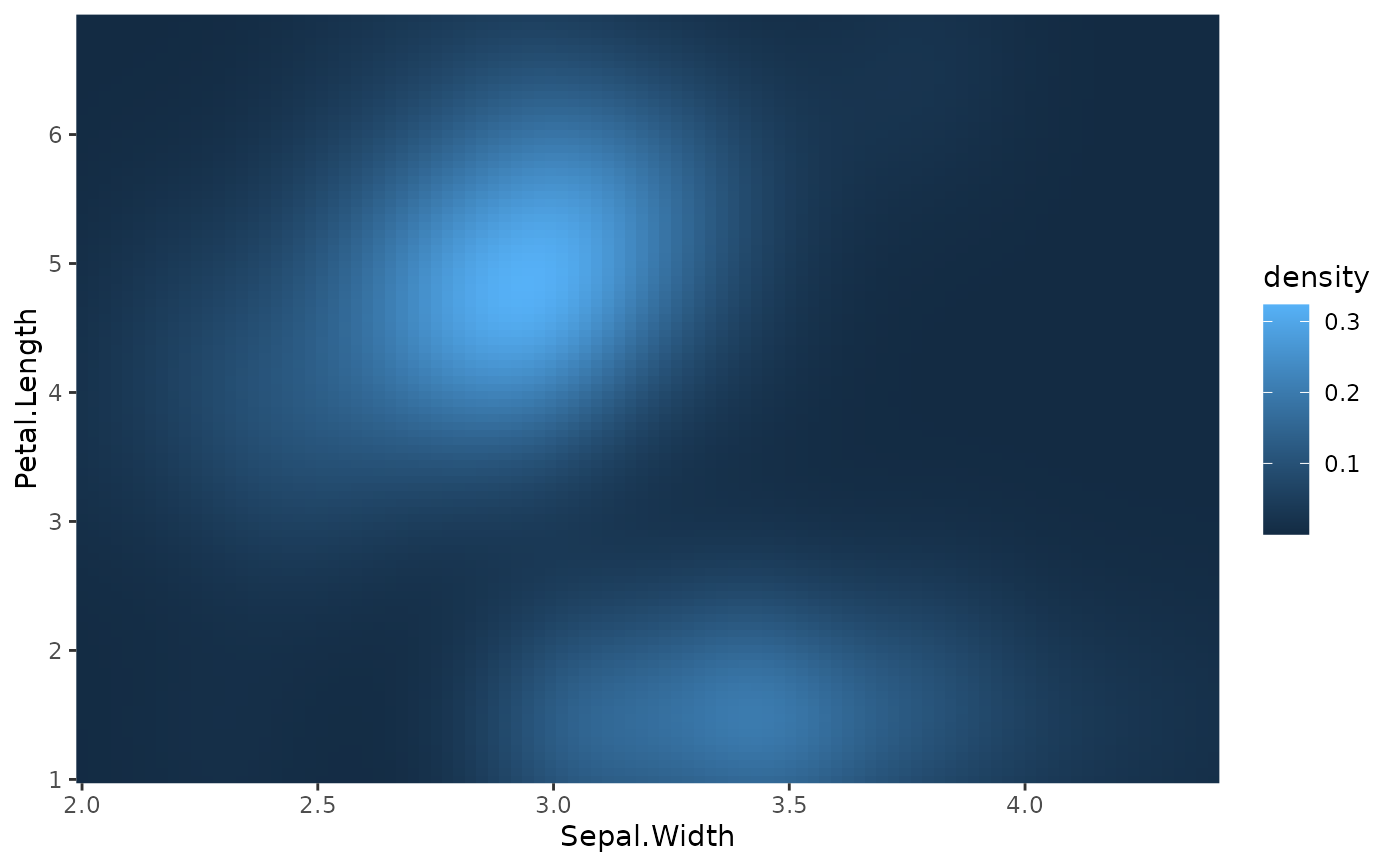
 ggplot() +
geom_from_list(list(
geom = "density_2d_raster", data = iris,
aes = list(x = "Sepal.Width", y = "Petal.Length"),
contour = FALSE
))
ggplot() +
geom_from_list(list(
geom = "density_2d_raster", data = iris,
aes = list(x = "Sepal.Width", y = "Petal.Length"),
contour = FALSE
))
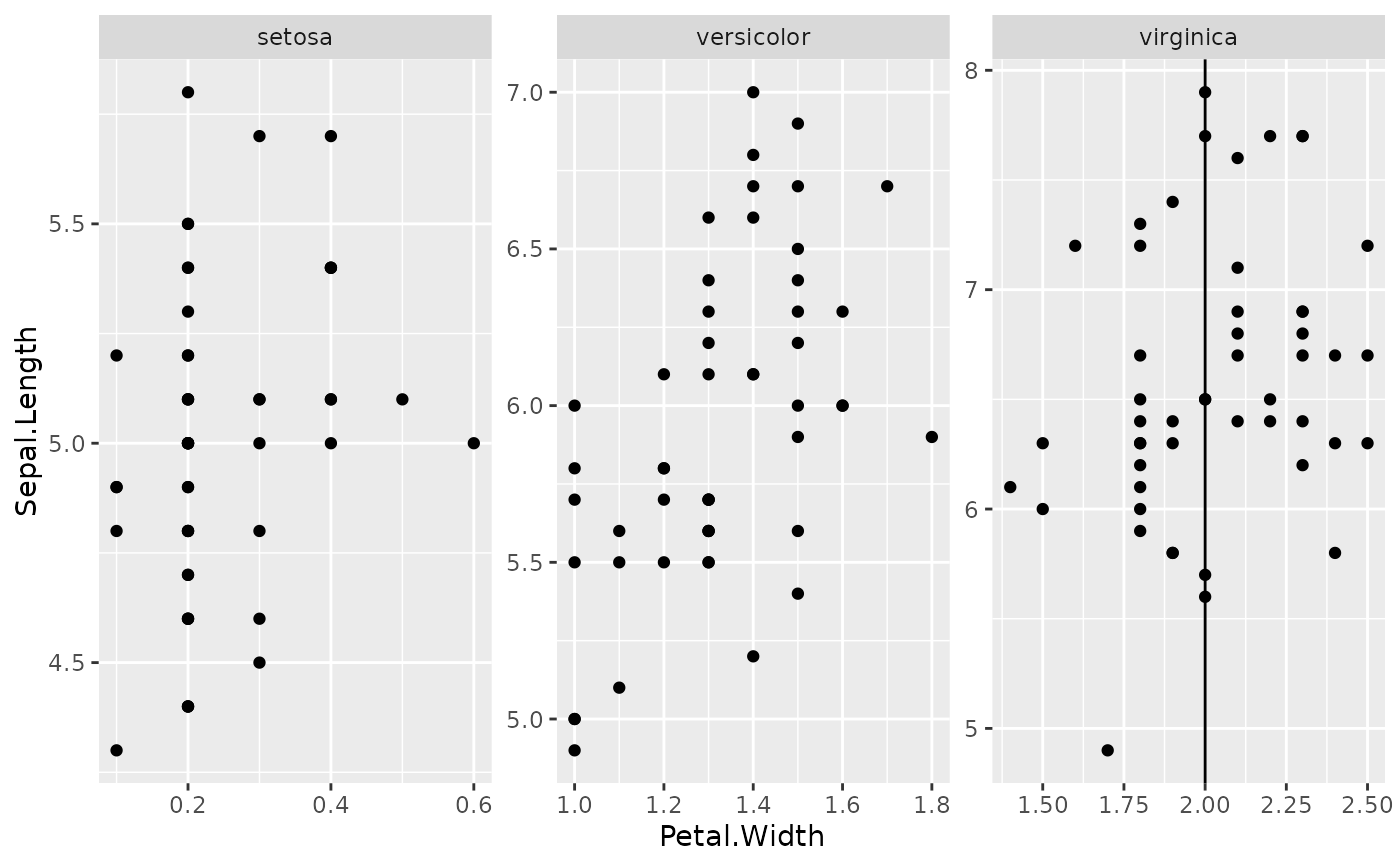
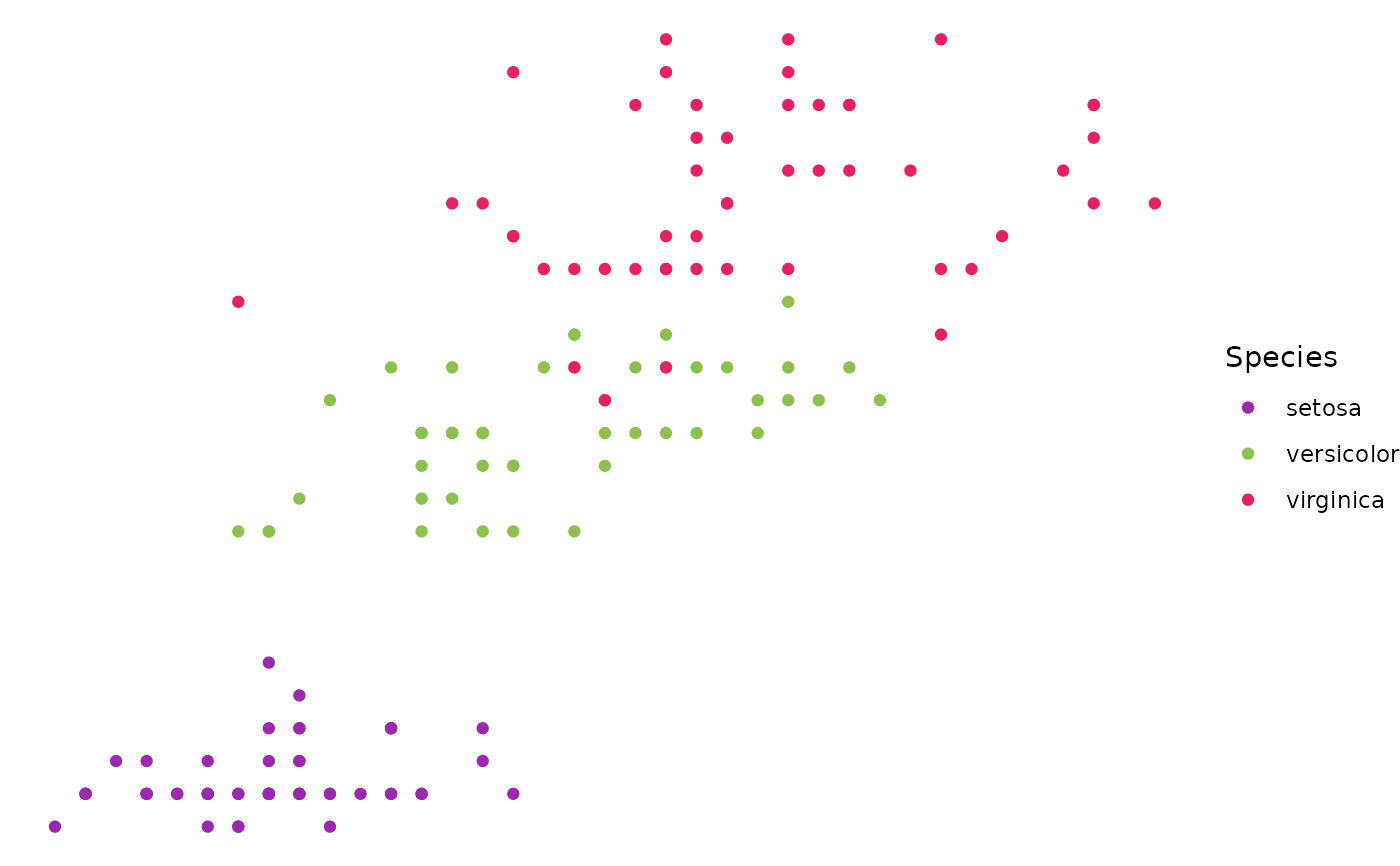
 # Example 4 (facet and coord flip) --------------------------
ggplot(iris, aes(x = Sepal.Length, y = Petal.Width)) +
geom_point() +
geom_from_list(list(geom = "hline", yintercept = 2)) +
geom_from_list(list(geom = "coord_flip")) +
geom_from_list(list(geom = "facet_wrap", facets = "~ Species", scales = "free"))
# Example 4 (facet and coord flip) --------------------------
ggplot(iris, aes(x = Sepal.Length, y = Petal.Width)) +
geom_point() +
geom_from_list(list(geom = "hline", yintercept = 2)) +
geom_from_list(list(geom = "coord_flip")) +
geom_from_list(list(geom = "facet_wrap", facets = "~ Species", scales = "free"))
 # Example 5 (theme and scales) --------------------------
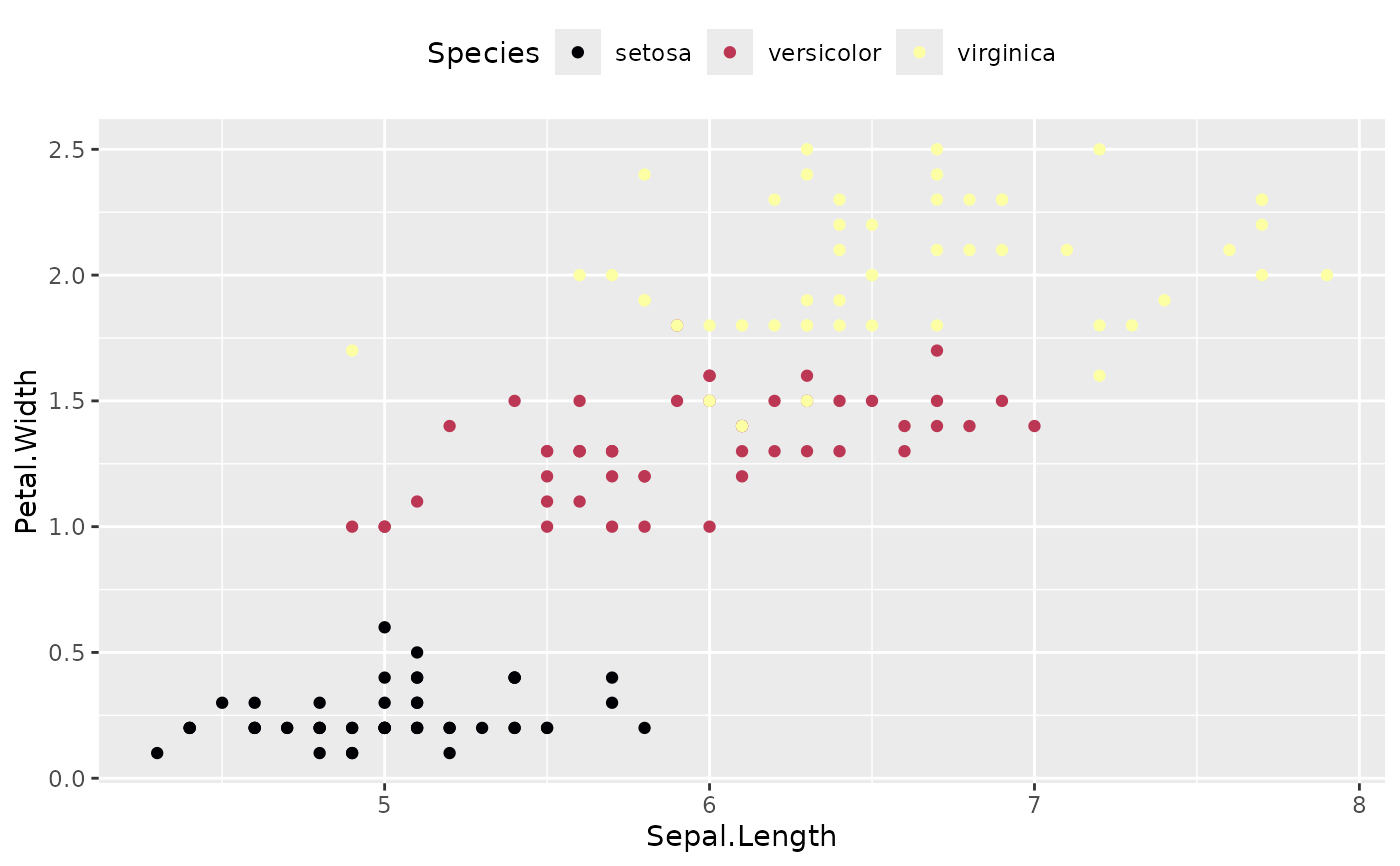
ggplot(iris, aes(x = Sepal.Length, y = Petal.Width, color = Species)) +
geom_point() +
geom_from_list(list(geom = "scale_color_viridis_d", option = "inferno")) +
geom_from_list(list(geom = "theme", legend.position = "top"))
# Example 5 (theme and scales) --------------------------
ggplot(iris, aes(x = Sepal.Length, y = Petal.Width, color = Species)) +
geom_point() +
geom_from_list(list(geom = "scale_color_viridis_d", option = "inferno")) +
geom_from_list(list(geom = "theme", legend.position = "top"))
 ggplot(iris, aes(x = Sepal.Length, y = Petal.Width, color = Species)) +
geom_point() +
geom_from_list(list(geom = "scale_color_material_d", palette = "rainbow")) +
geom_from_list(list(geom = "theme_void"))
ggplot(iris, aes(x = Sepal.Length, y = Petal.Width, color = Species)) +
geom_point() +
geom_from_list(list(geom = "scale_color_material_d", palette = "rainbow")) +
geom_from_list(list(geom = "theme_void"))
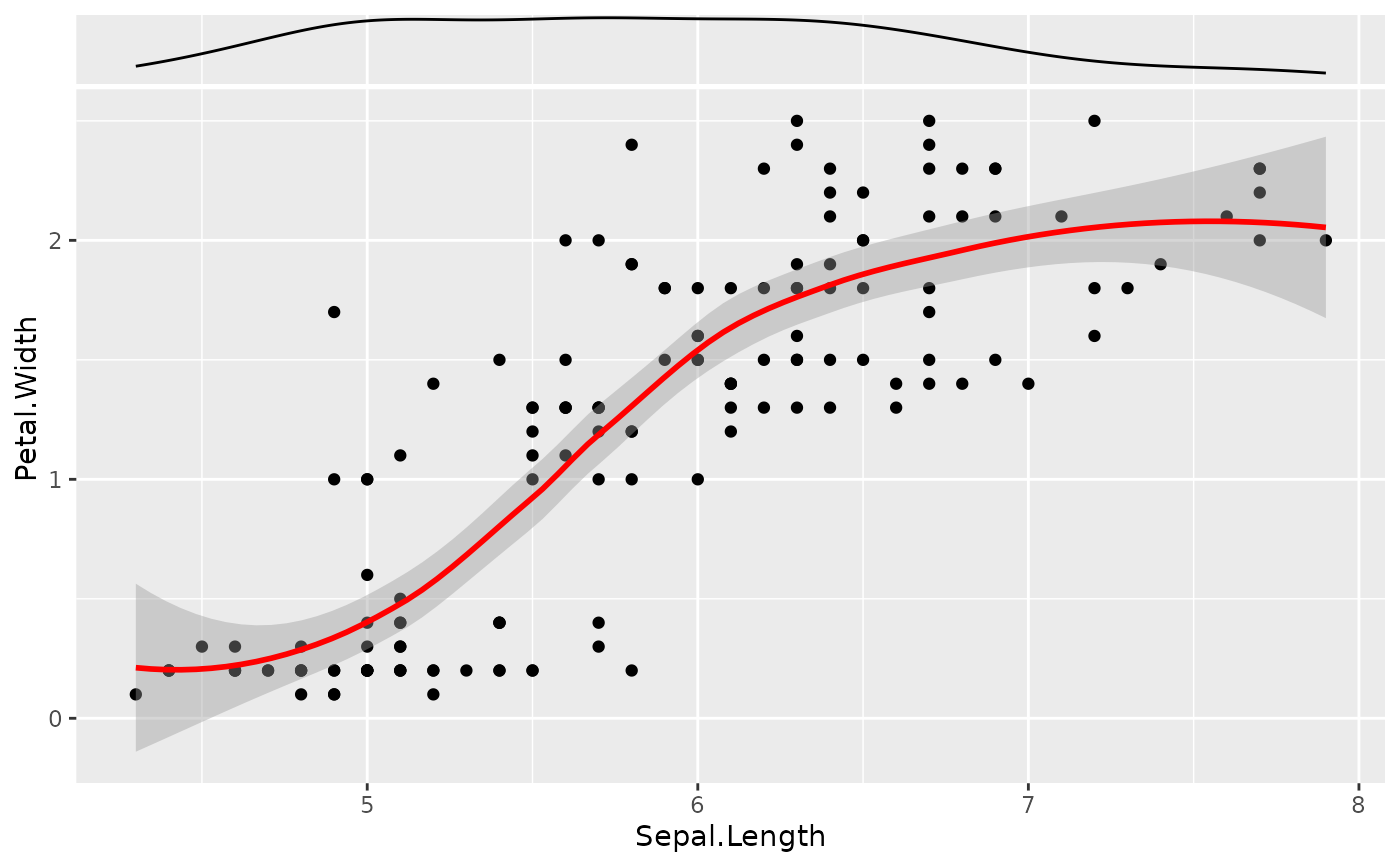
 # Example 5 (Smooths and side densities) --------------------------
ggplot(iris, aes(x = Sepal.Length, y = Petal.Width)) +
geom_from_list(list(geom = "point")) +
geom_from_list(list(geom = "smooth", color = "red")) +
geom_from_list(list(aes = list(x = "Sepal.Length"), geom = "ggside::geom_xsidedensity")) +
geom_from_list(list(geom = "ggside::scale_xsidey_continuous", breaks = NULL))
# Example 5 (Smooths and side densities) --------------------------
ggplot(iris, aes(x = Sepal.Length, y = Petal.Width)) +
geom_from_list(list(geom = "point")) +
geom_from_list(list(geom = "smooth", color = "red")) +
geom_from_list(list(aes = list(x = "Sepal.Length"), geom = "ggside::geom_xsidedensity")) +
geom_from_list(list(geom = "ggside::scale_xsidey_continuous", breaks = NULL))