Add dot-densities for binary y variables
Arguments
- data
A dataframe.
- x, y
Characters corresponding to the x and y axis. Note that
ymust be a variable with two unique values.- scale
Character specifying method of scaling the dot-densities. Can be:
'auto'(corresponding to the square root of the proportion),'proportion','density'or a custom list with values for each factor level (see examples).- ...
Other arguments passed to
ggdist::geom_dots.
Examples
library(ggplot2)
library(see)
data <- iris[1:100, ]
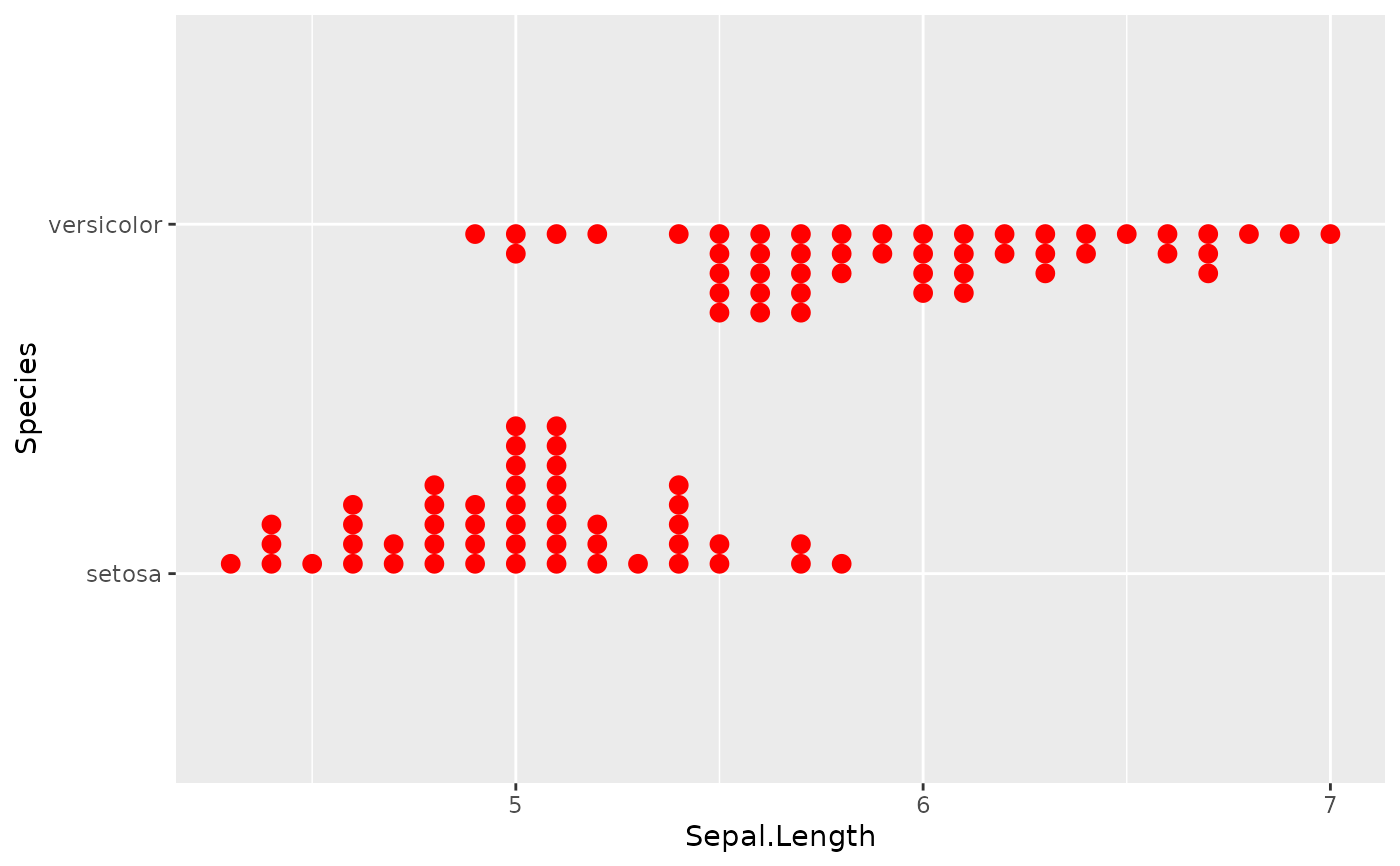
ggplot() +
geom_binomdensity(data,
x = "Sepal.Length",
y = "Species",
fill = "red",
color = NA
)
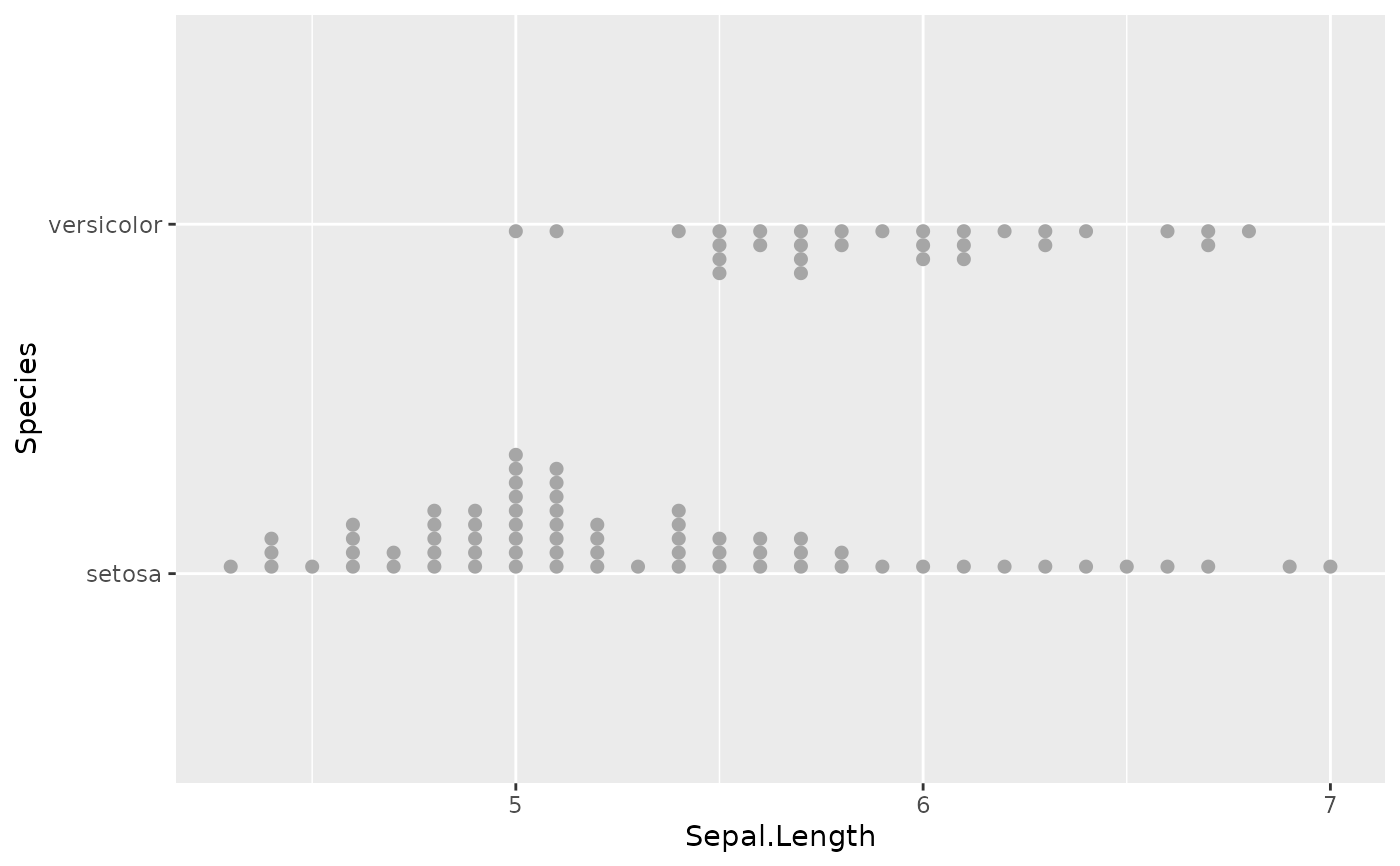
 # Different scales
data[1:70, "Species"] <- "setosa" # Create unbalanced proportions
ggplot() +
geom_binomdensity(data, x = "Sepal.Length", y = "Species", scale = "auto")
# Different scales
data[1:70, "Species"] <- "setosa" # Create unbalanced proportions
ggplot() +
geom_binomdensity(data, x = "Sepal.Length", y = "Species", scale = "auto")
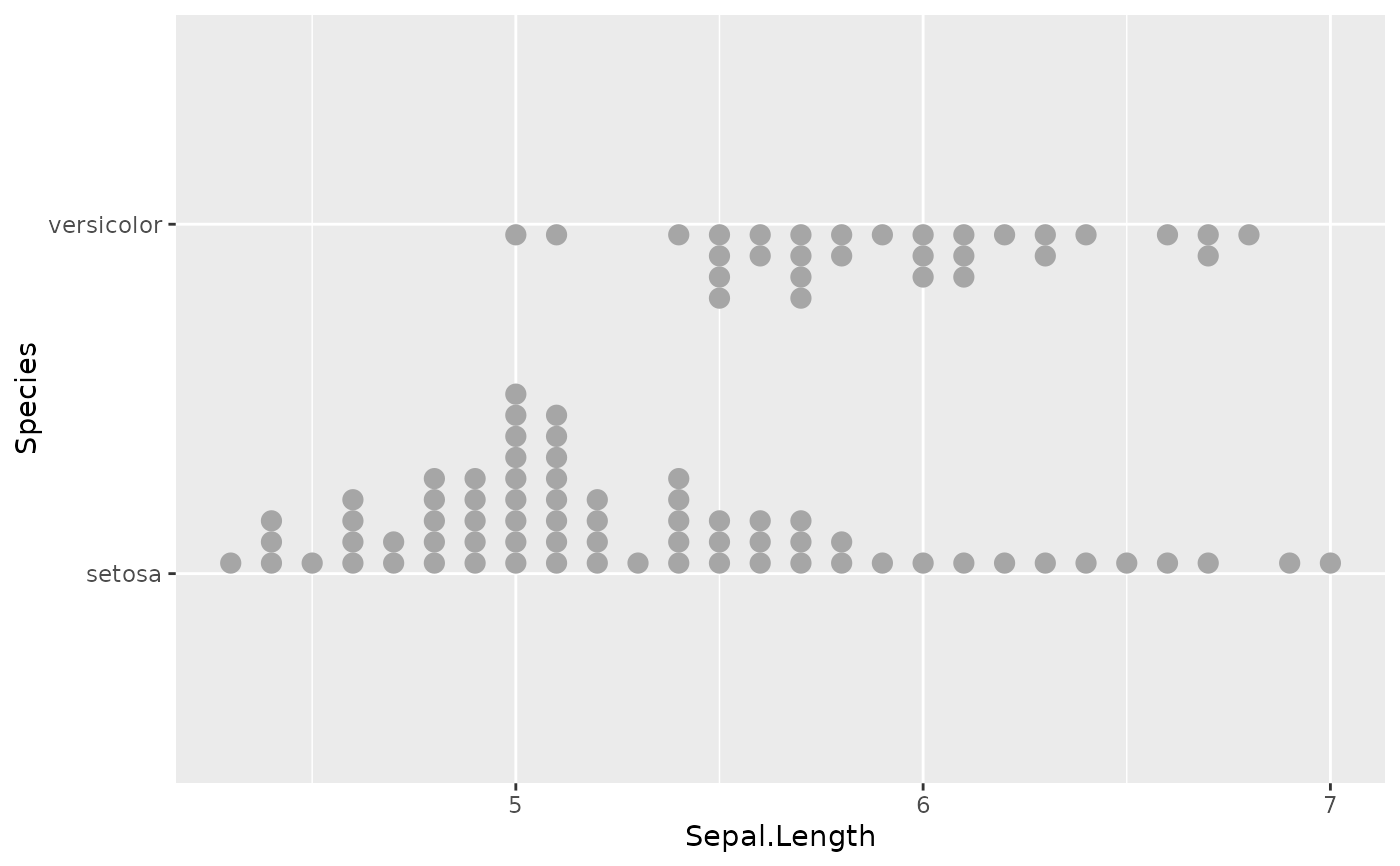 ggplot() +
geom_binomdensity(data, x = "Sepal.Length", y = "Species", scale = "density")
ggplot() +
geom_binomdensity(data, x = "Sepal.Length", y = "Species", scale = "density")
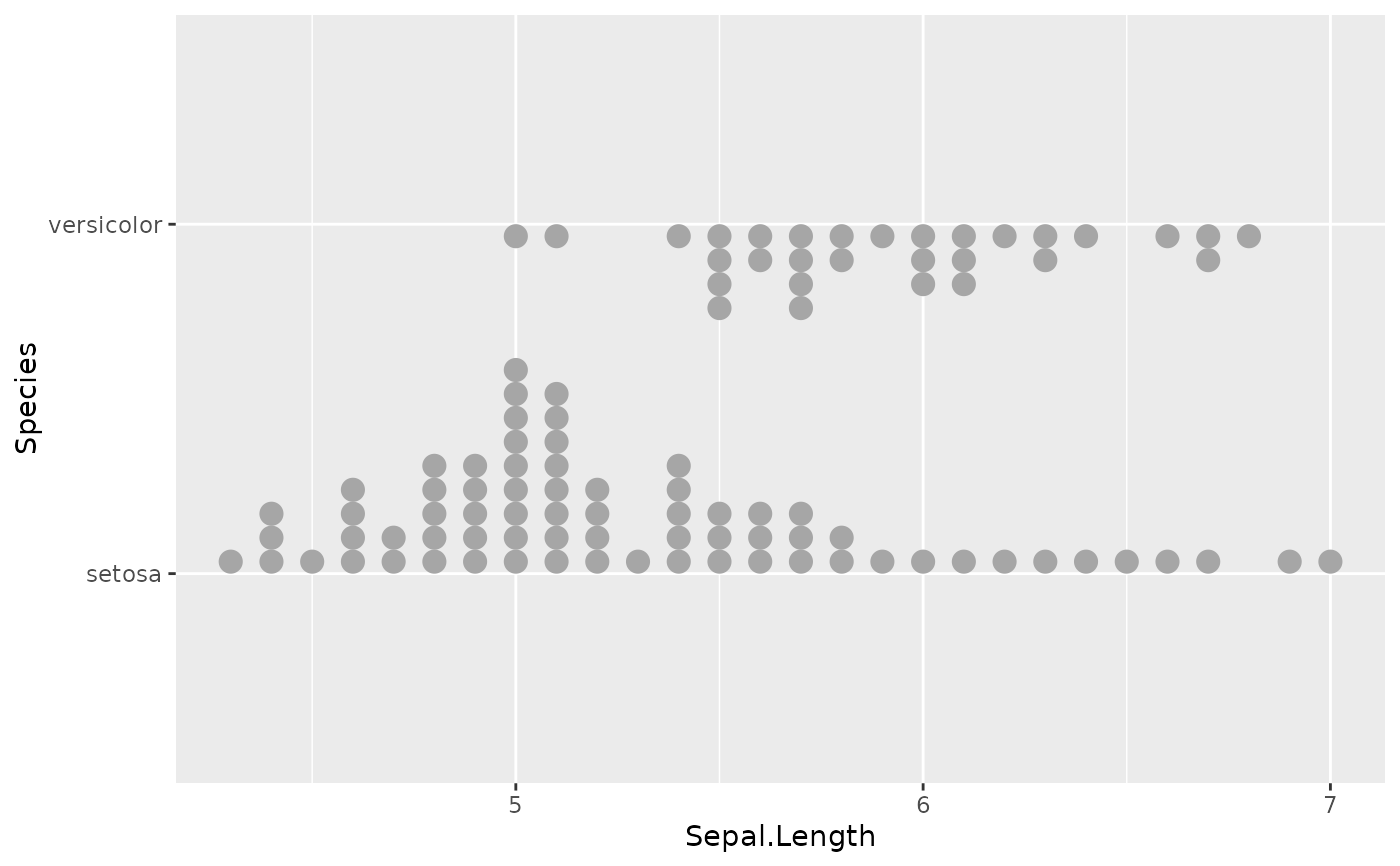 ggplot() +
geom_binomdensity(data, x = "Sepal.Length", y = "Species", scale = "proportion")
ggplot() +
geom_binomdensity(data, x = "Sepal.Length", y = "Species", scale = "proportion")
 ggplot() +
geom_binomdensity(
data,
x = "Sepal.Length", y = "Species",
scale = list("setosa" = 0.4, "versicolor" = 0.6)
)
ggplot() +
geom_binomdensity(
data,
x = "Sepal.Length", y = "Species",
scale = list("setosa" = 0.4, "versicolor" = 0.6)
)