Add a radar coordinate system useful for radar charts.
Examples
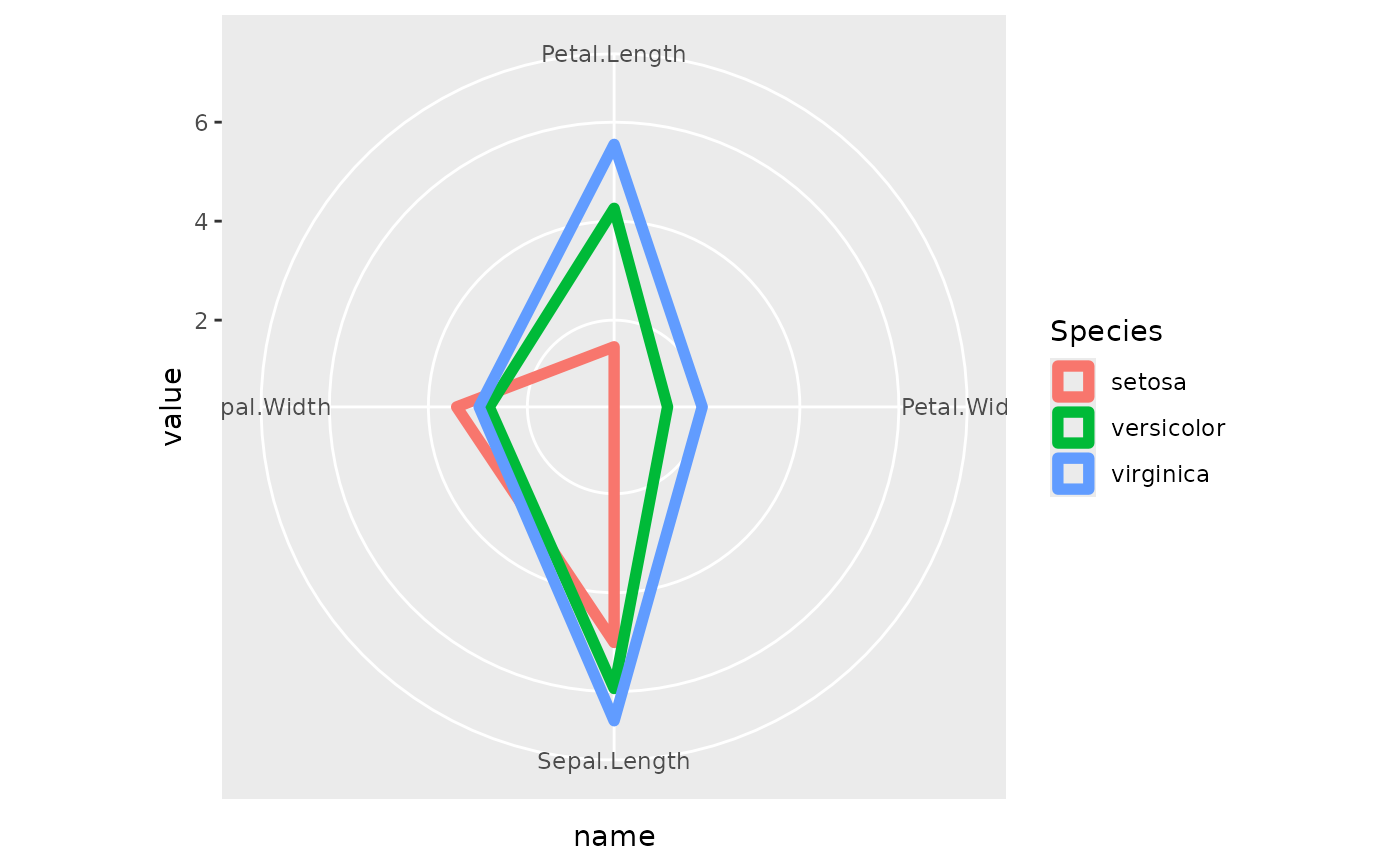
library(ggplot2)

# Create a radar/spider chart with ggplot:
data(iris)
data <- aggregate(iris[-5], list(Species = iris$Species), mean)
data <- datawizard::data_to_long(
  data,
  c("Sepal.Length", "Sepal.Width", "Petal.Length", "Petal.Width")
)

ggplot(data, aes(x = name, y = value, color = Species, group = Species)) +
  geom_polygon(fill = NA, linewidth = 2) +
  coord_radar(start = -pi / 4)