The data_plot() function usually stores information (such as title, axes
labels, etc.) as attributes, while add_plot_attributes() adds this
information to the plot.
Examples
# \donttest{
library(rstanarm)
library(bayestestR)
library(see)
library(ggplot2)
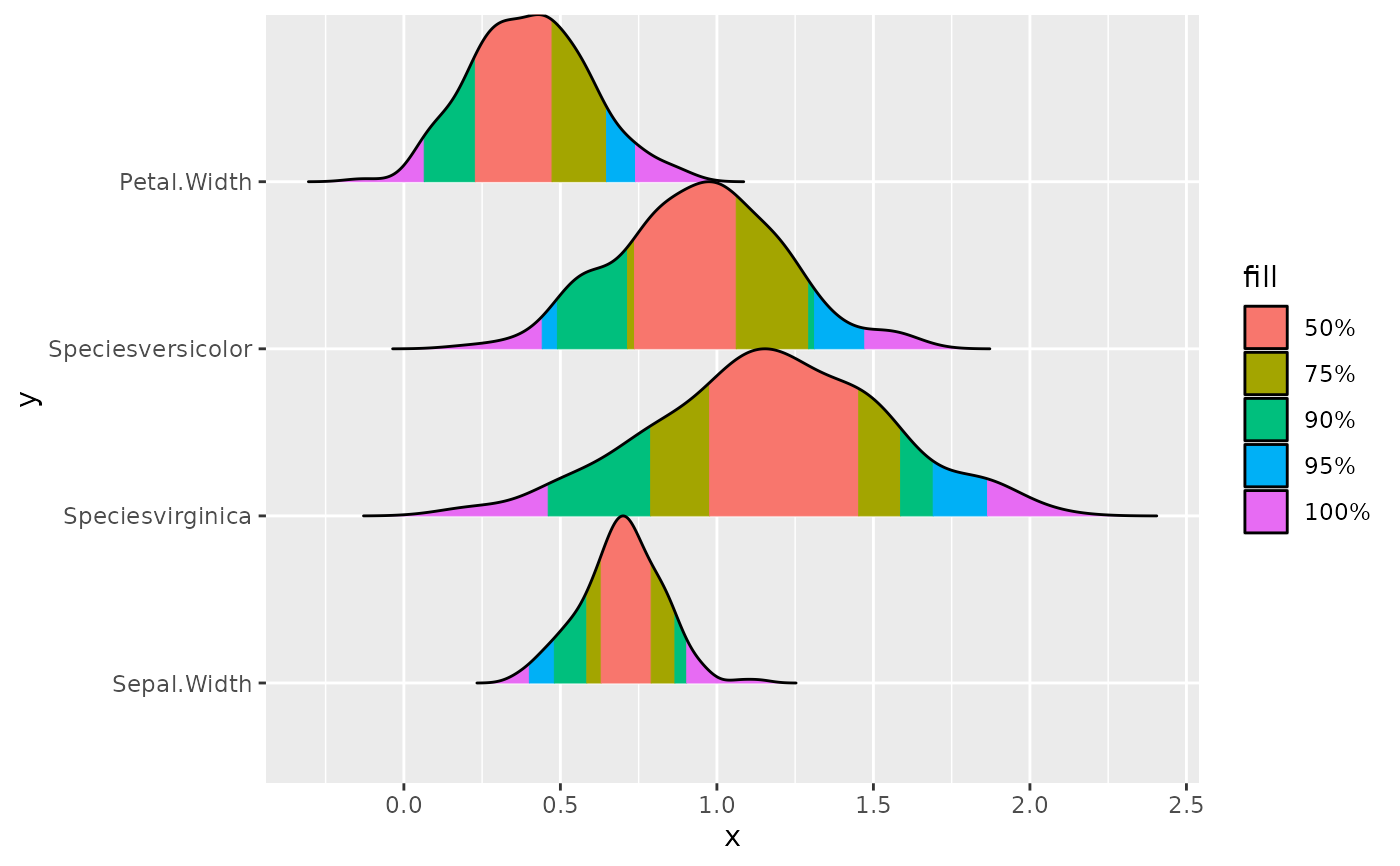
model <- suppressWarnings(stan_glm(
Sepal.Length ~ Petal.Width + Species + Sepal.Width,
data = iris,
chains = 2, iter = 200, refresh = 0
))
result <- bayestestR::hdi(model, ci = c(0.5, 0.75, 0.9, 0.95))
data <- data_plot(result, data = model)
p <- ggplot(
data,
aes(x = x, y = y, height = height, group = y, fill = fill)
) +
ggridges::geom_ridgeline_gradient()
p
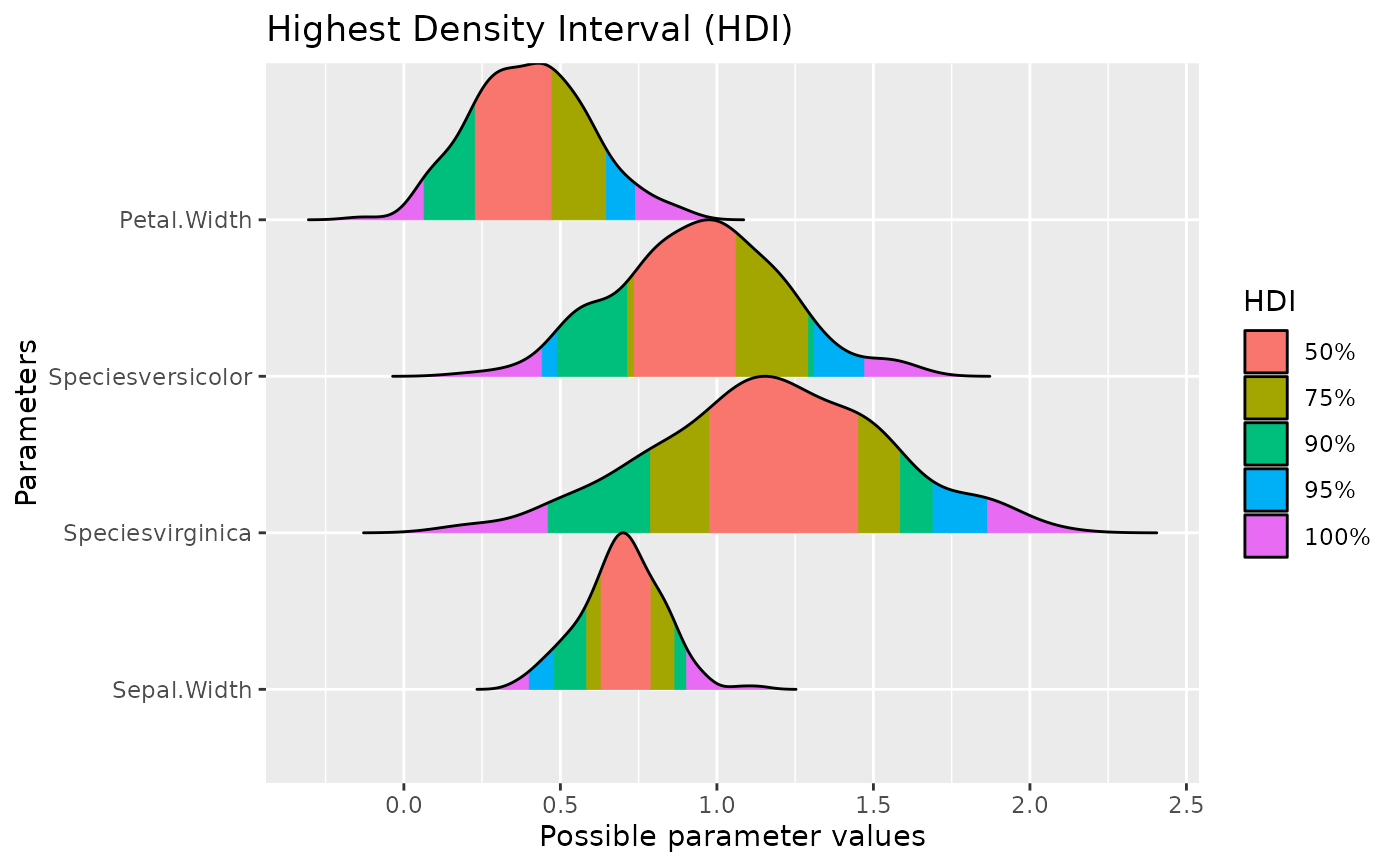
 p + add_plot_attributes(data)
 # }
# }